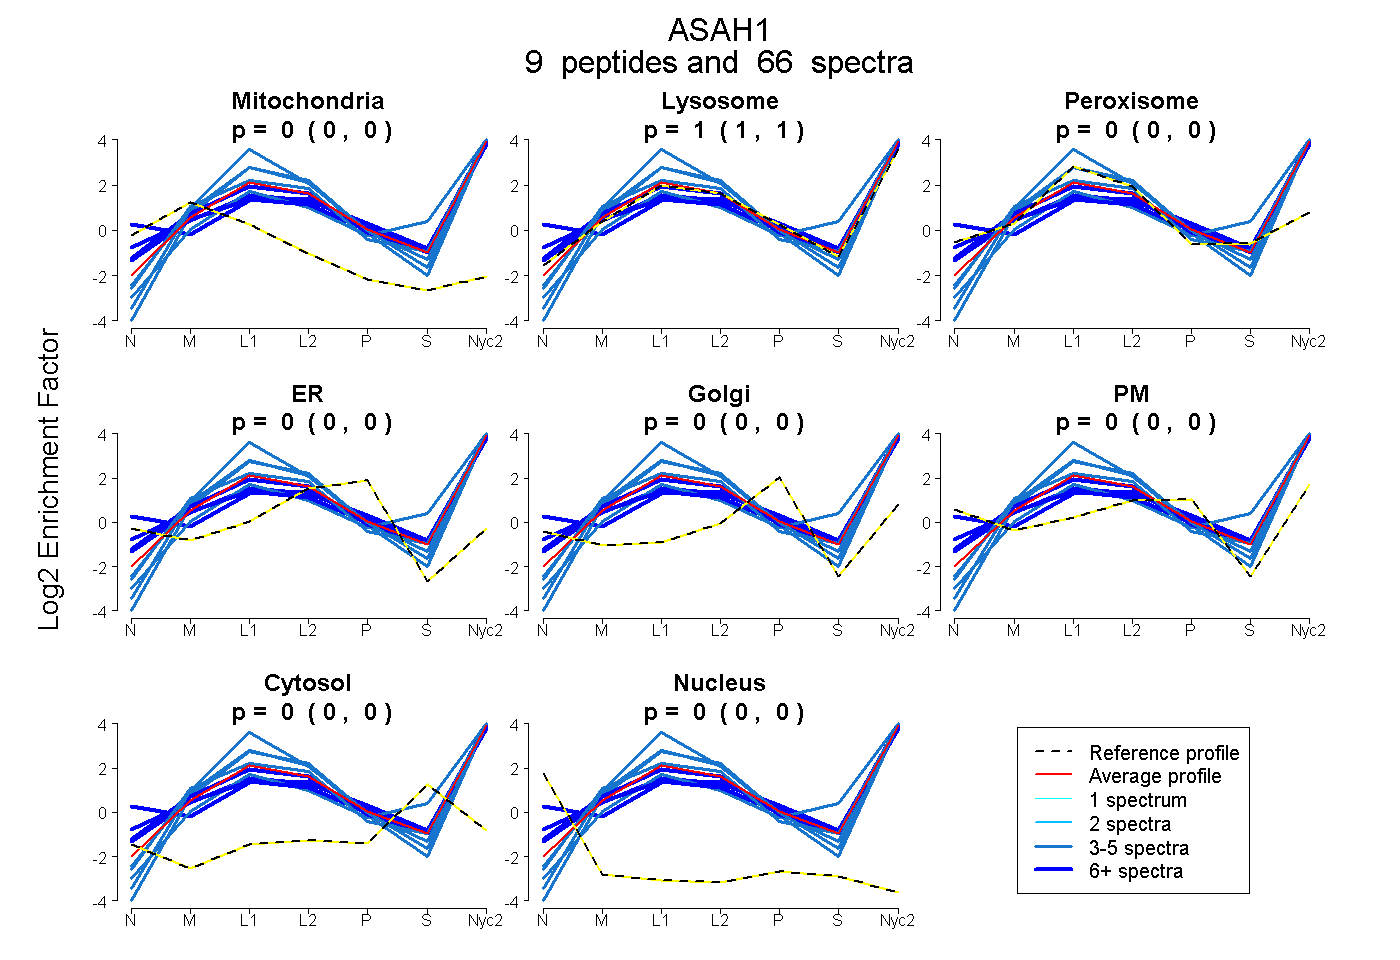
 9
9peptides
spectra
0.000 | 0.000
1.000 | 1.000
0.000 | 0.000
0.000 | 0.000
0.000 | 0.000
0.000 | 0.000
0.000 | 0.000
0.000 | 0.000
| Plot | Mito | Lyso | Perox | ER | Golgi | PM | Cytosol | Nucleus | |||||
| Expt A |
9 peptides |
66 spectra |
|
0.000 0.000 | 0.000 |
1.000 1.000 | 1.000 |
0.000 0.000 | 0.000 |
0.000 0.000 | 0.000 |
0.000 0.000 | 0.000 |
0.000 0.000 | 0.000 |
0.000 0.000 | 0.000 |
0.000 0.000 | 0.000 |
| 10 spectra, NAQWVGFITR | 0.000 | 1.000 | 0.000 | 0.000 | 0.000 | 0.000 | 0.000 | 0.000 | ||
| 4 spectra, LTVFTTLIDVTK | 0.000 | 1.000 | 0.000 | 0.000 | 0.000 | 0.000 | 0.000 | 0.000 | ||
| 3 spectra, ESLDVYELDPK | 0.000 | 1.000 | 0.000 | 0.000 | 0.000 | 0.000 | 0.000 | 0.000 | ||
| 12 spectra, DQFESHLR | 0.000 | 0.886 | 0.000 | 0.000 | 0.000 | 0.109 | 0.006 | 0.000 | ||
| 3 spectra, IMQMVDEK | 0.000 | 0.890 | 0.000 | 0.000 | 0.000 | 0.000 | 0.110 | 0.000 | ||
| 19 spectra, GHLLHGR | 0.000 | 0.687 | 0.000 | 0.000 | 0.000 | 0.313 | 0.000 | 0.000 | ||
| 5 spectra, STYPPSGPTYR | 0.000 | 1.000 | 0.000 | 0.000 | 0.000 | 0.000 | 0.000 | 0.000 | ||
| 4 spectra, WYVVQTNYDR | 0.000 | 1.000 | 0.000 | 0.000 | 0.000 | 0.000 | 0.000 | 0.000 | ||
| 6 spectra, NTLFLDDR | 0.000 | 0.942 | 0.000 | 0.000 | 0.000 | 0.000 | 0.054 | 0.004 |
| Plot | Mito | Lyso or Perox | ER | Golgi | PM | Cytosol | Nucleus | ||||||
| Expt B |
9 peptides |
23 spectra |
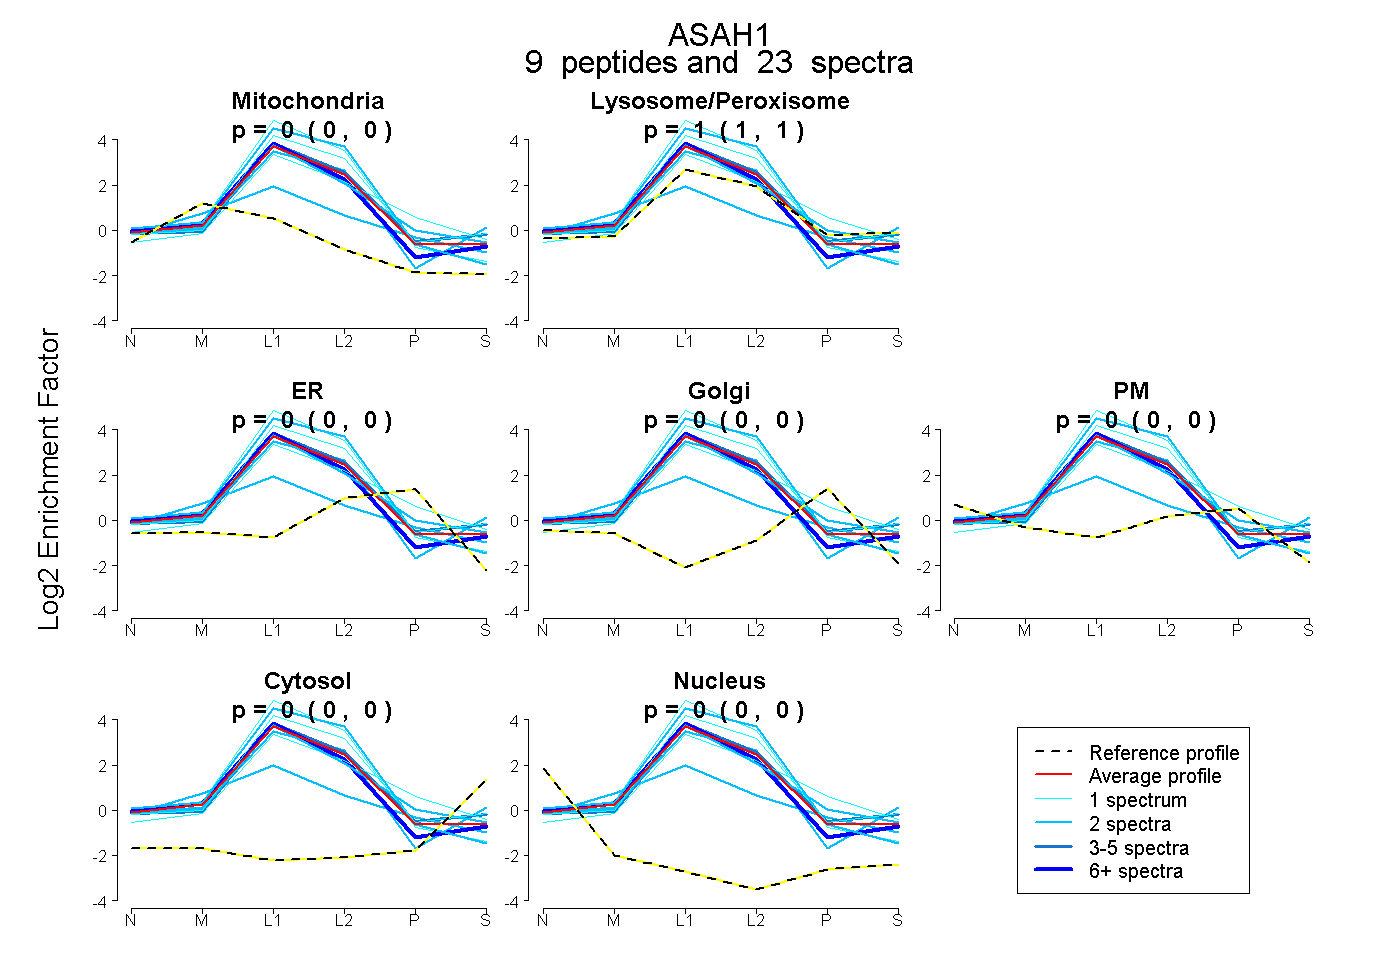 |
0.000 0.000 | 0.000 |
1.000 1.000 | 1.000 |
0.000 0.000 | 0.000 |
0.000 0.000 | 0.000 |
0.000 0.000 | 0.000 |
0.000 0.000 | 0.000 |
0.000 0.000 | 0.000 |
|||
| Plot | Lyso | Other | |||||||||||
| Expt C |
14 peptides |
115 spectra |
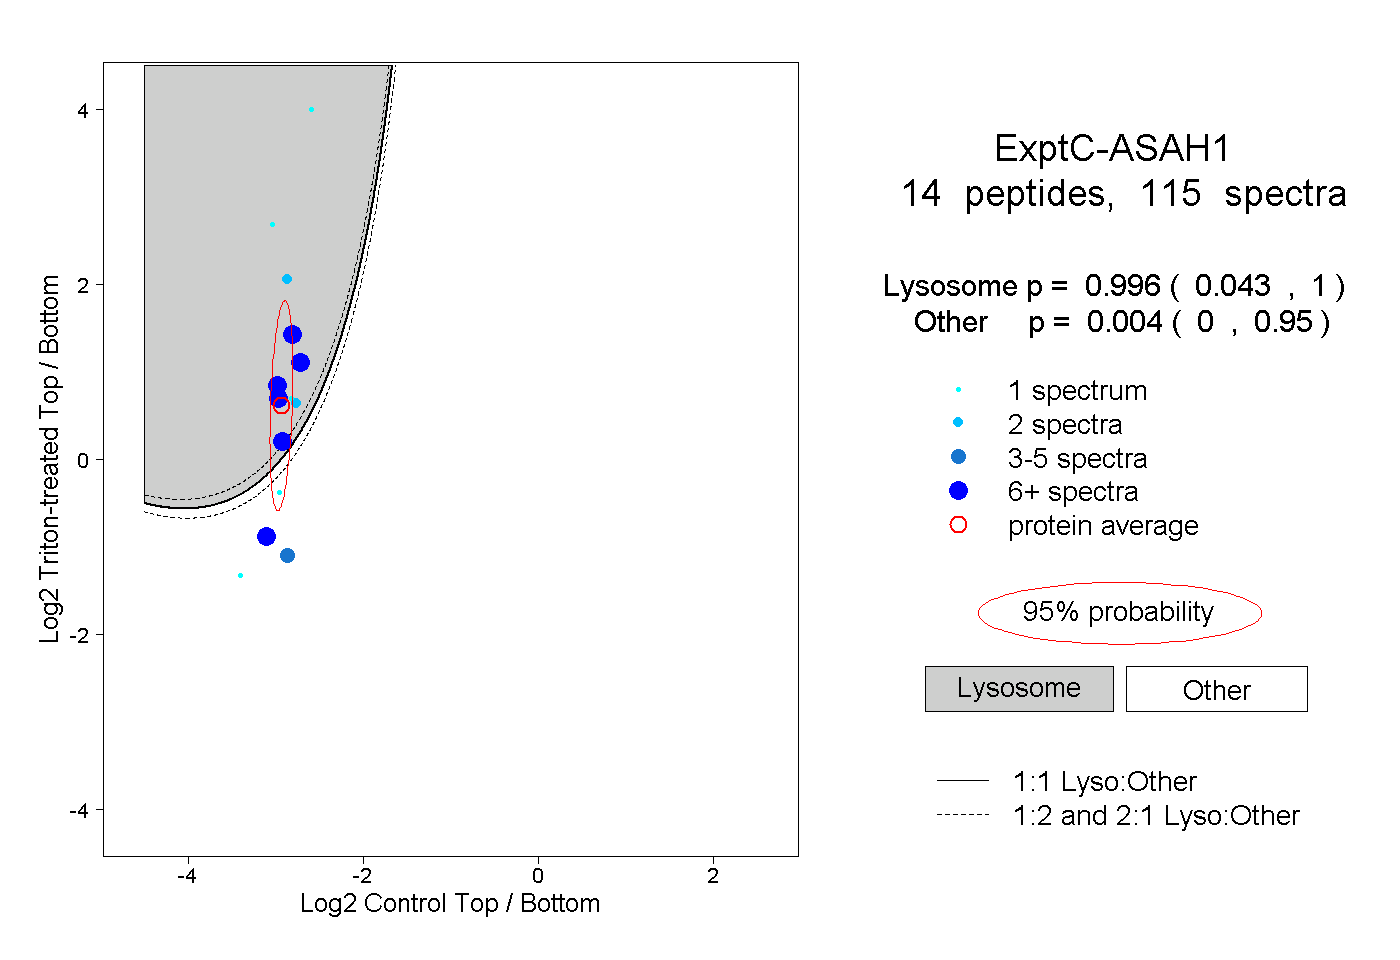 |
0.996 0.043 | 1.000 |
0.004 0.000 | 0.950 |
||||||||
| Plot | Lyso | Other | |||||||||||
| Expt D |
3 peptides |
7 spectra |
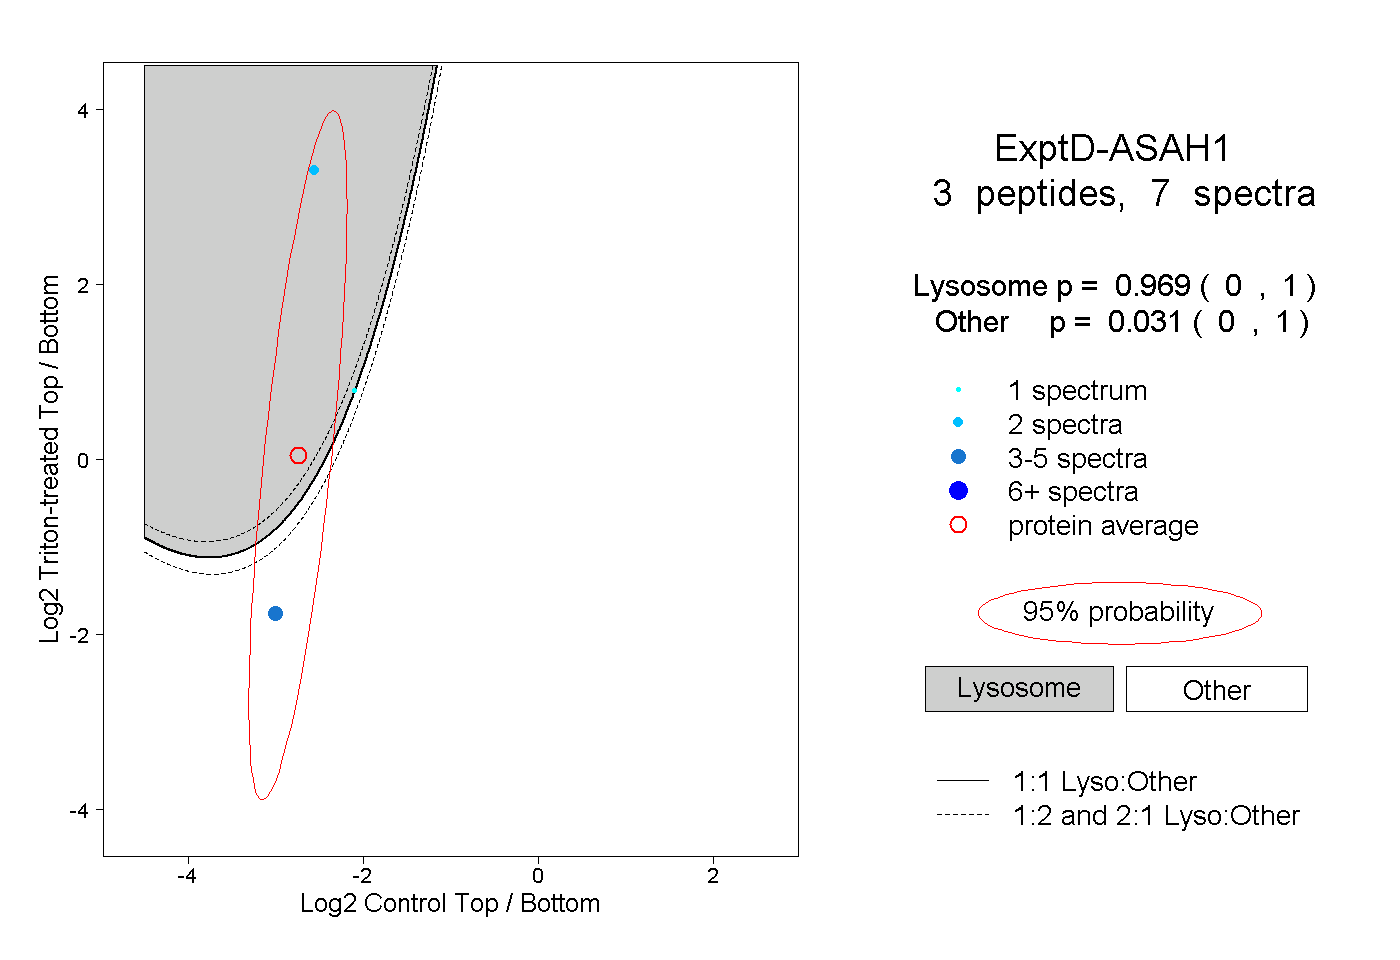 |
0.969 0.000 | 1.000 |
0.031 0.000 | 1.000 |