 4
4peptides
spectra
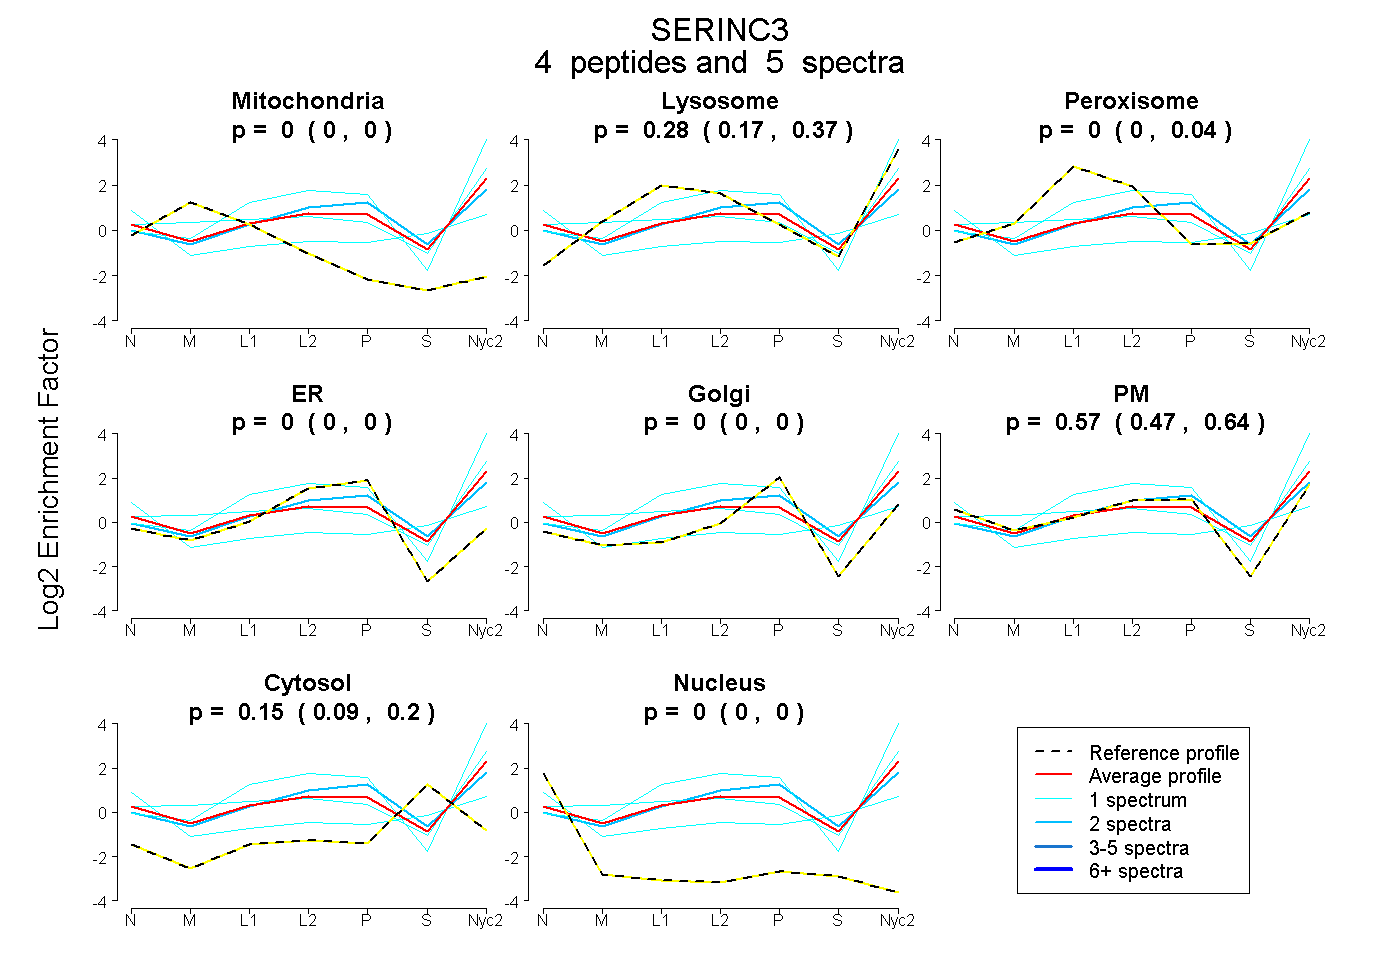
0.000 | 0.000
0.166 | 0.367
0.000 | 0.043
0.000 | 0.000
0.000 | 0.003
0.472 | 0.638
0.091 | 0.200
0.000 | 0.000
2peptides
spectra
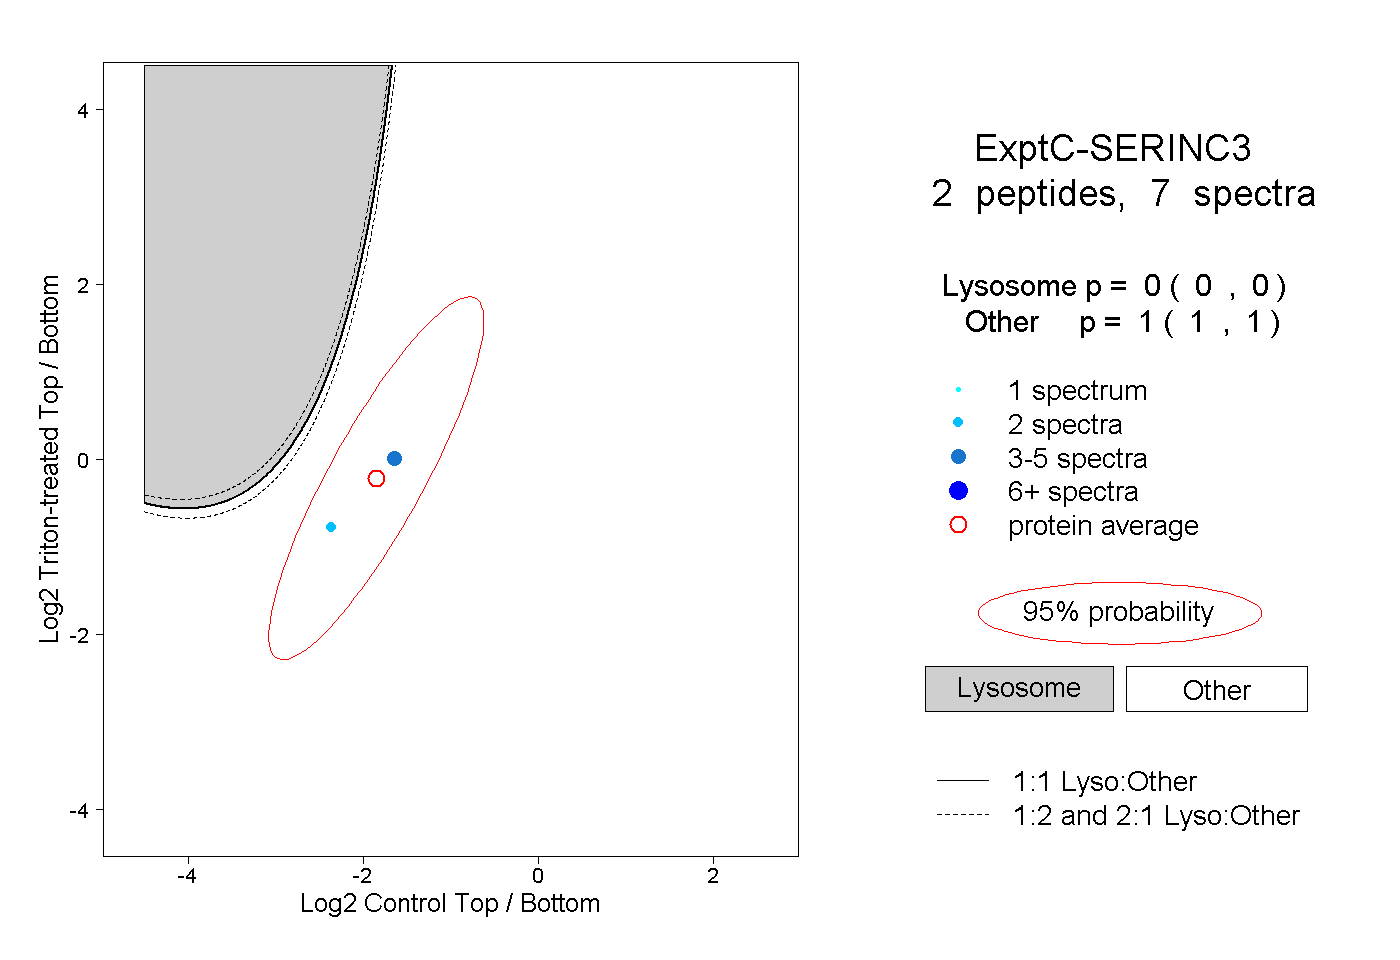
0.000 | 0.000
1.000 | 1.000
1peptide
spectra
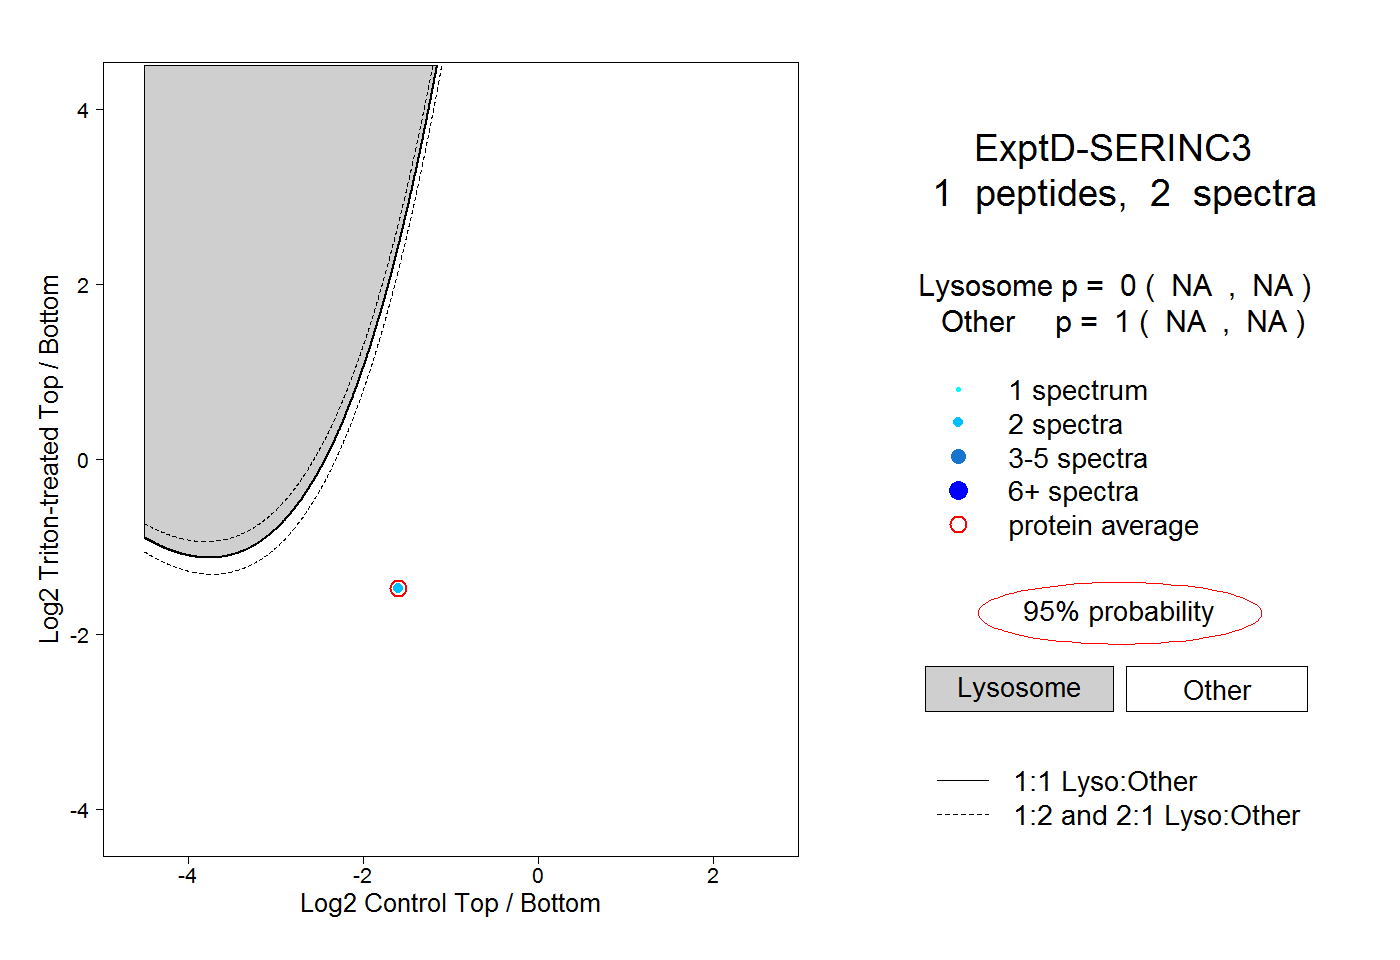
NA | NA
NA | NA