 6
6peptides
spectra
0.919 | 0.933
0.000 | 0.000
0.000 | 0.000
0.000 | 0.000
0.000 | 0.000
0.000 | 0.000
0.000 | 0.000
0.065 | 0.079
| Plot | Mito | Lyso | Perox | ER | Golgi | PM | Cytosol | Nucleus | |||||
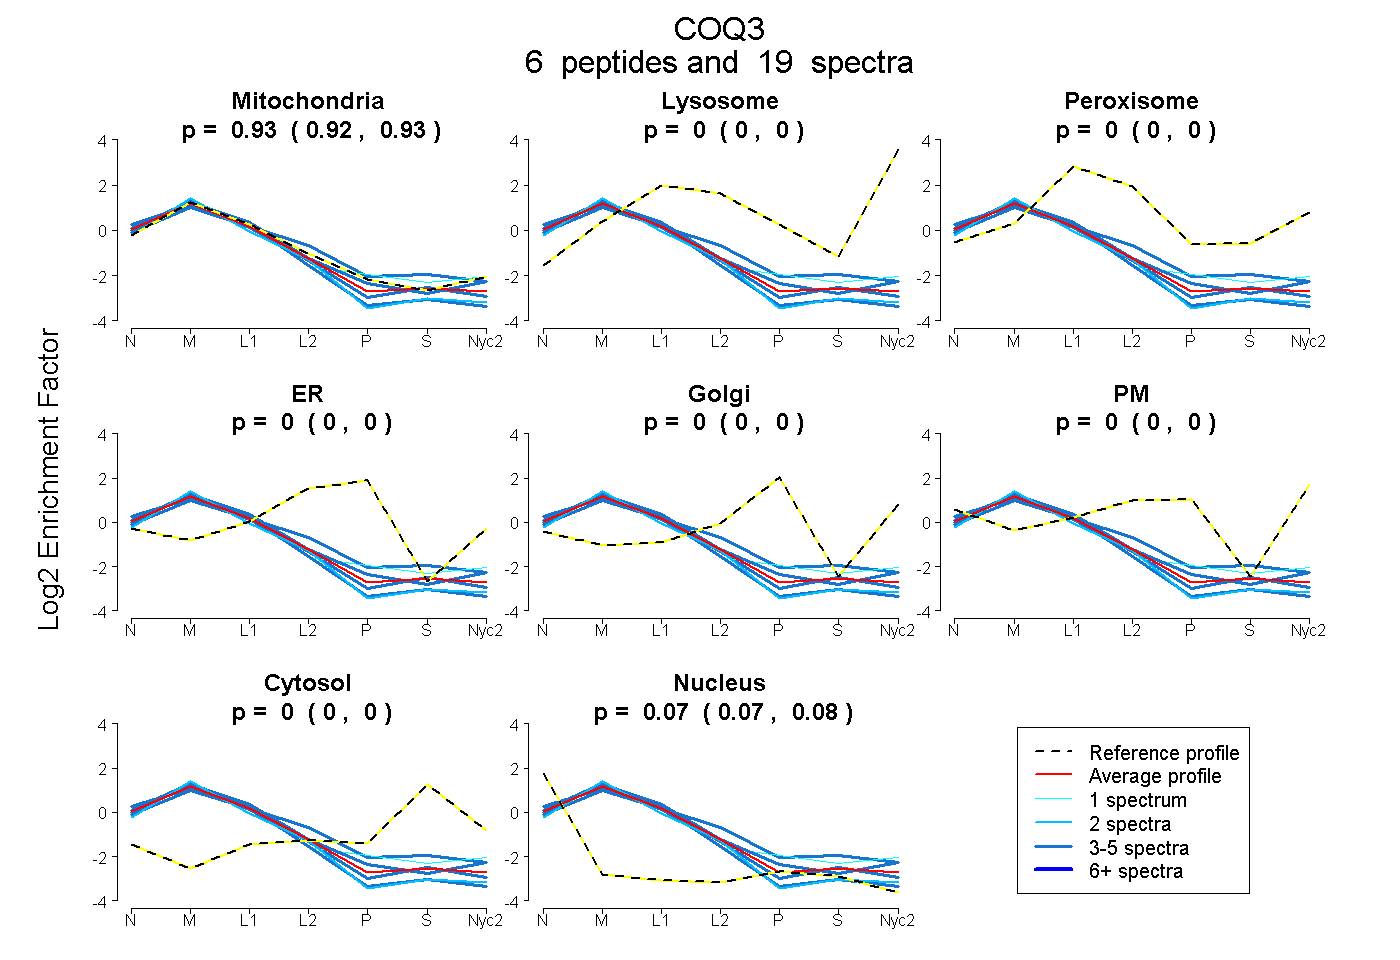
| Expt A |
6 peptides |
19 spectra |
|
0.927 0.919 | 0.933 |
0.000 0.000 | 0.000 |
0.000 0.000 | 0.000 |
0.000 0.000 | 0.000 |
0.000 0.000 | 0.000 |
0.000 0.000 | 0.000 |
0.000 0.000 | 0.000 |
0.073 0.065 | 0.079 |
| 2 spectra, LGASVVGIDPVAENIK | 0.909 | 0.000 | 0.000 | 0.000 | 0.000 | 0.000 | 0.000 | 0.091 | ||
| 3 spectra, IAQHHK | 0.970 | 0.000 | 0.000 | 0.000 | 0.000 | 0.000 | 0.000 | 0.030 | ||
| 1 spectrum, GTHTWEK | 0.936 | 0.000 | 0.000 | 0.000 | 0.002 | 0.000 | 0.024 | 0.037 | ||
| 4 spectra, ILDVGCGGGLLTEPLGR | 0.887 | 0.000 | 0.000 | 0.000 | 0.000 | 0.000 | 0.000 | 0.113 | ||
| 4 spectra, AQEHLEPAESA | 0.883 | 0.000 | 0.000 | 0.000 | 0.000 | 0.000 | 0.000 | 0.117 | ||
| 5 spectra, FAPLHSMNDLR | 0.858 | 0.000 | 0.053 | 0.000 | 0.000 | 0.000 | 0.071 | 0.019 |
| Plot | Mito | Lyso or Perox | ER | Golgi | PM | Cytosol | Nucleus | ||||||
| Expt B |
6 peptides |
10 spectra |
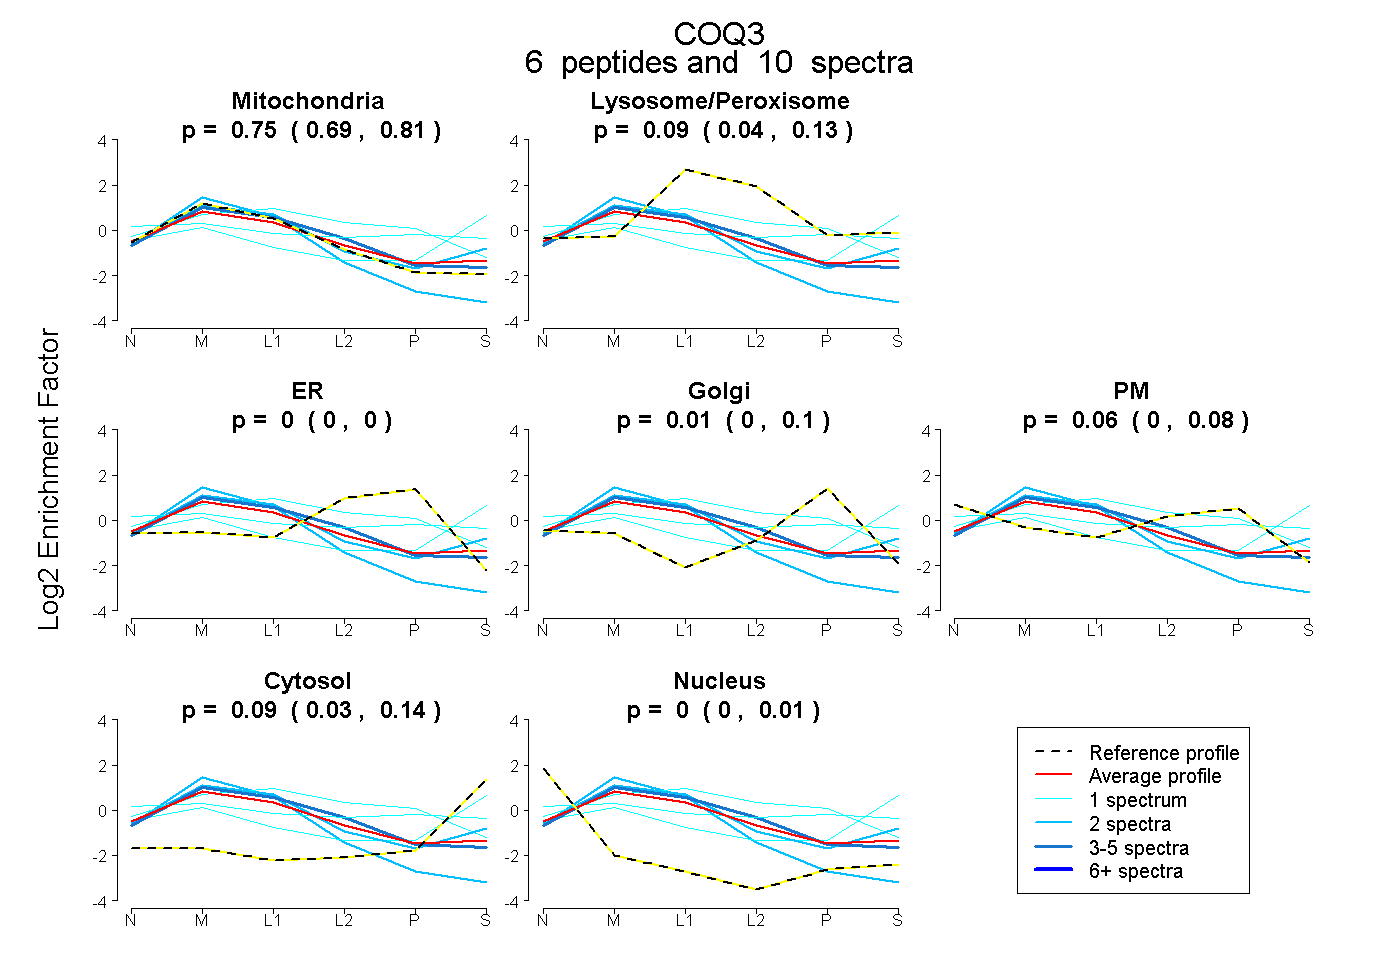 |
0.751 0.687 | 0.812 |
0.087 0.044 | 0.134 |
0.000 0.000 | 0.000 |
0.010 0.000 | 0.097 |
0.058 0.000 | 0.083 |
0.094 0.034 | 0.135 |
0.000 0.000 | 0.006 |
|||
| Plot | Lyso | Other | |||||||||||
| Expt C |
8 peptides |
35 spectra |
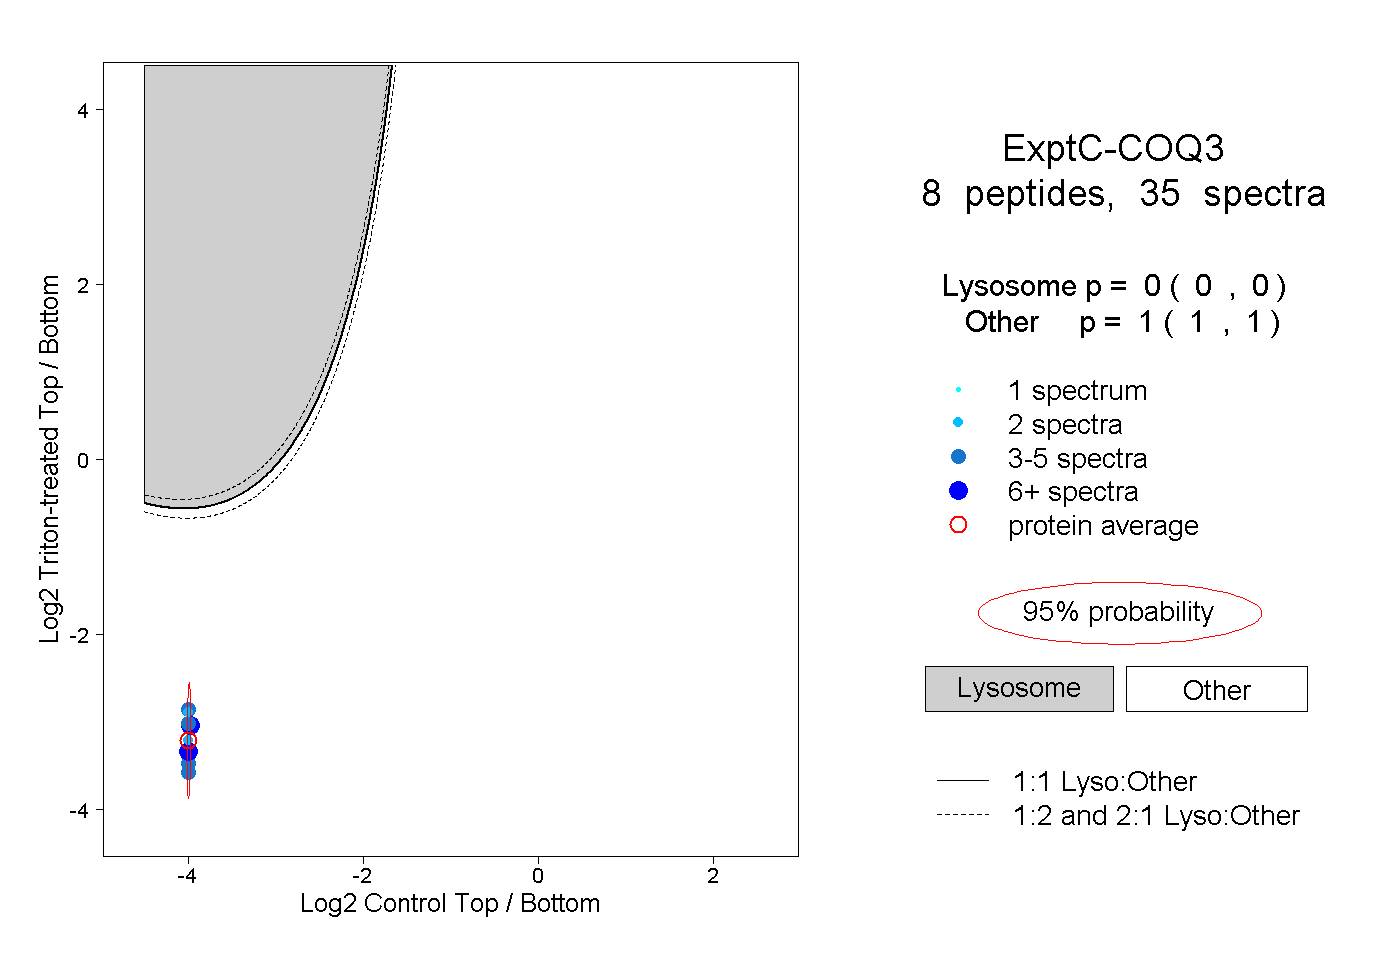 |
0.000 0.000 | 0.000 |
1.000 1.000 | 1.000 |
||||||||
| Plot | Lyso | Other | |||||||||||
| Expt D |
2 peptides |
6 spectra |
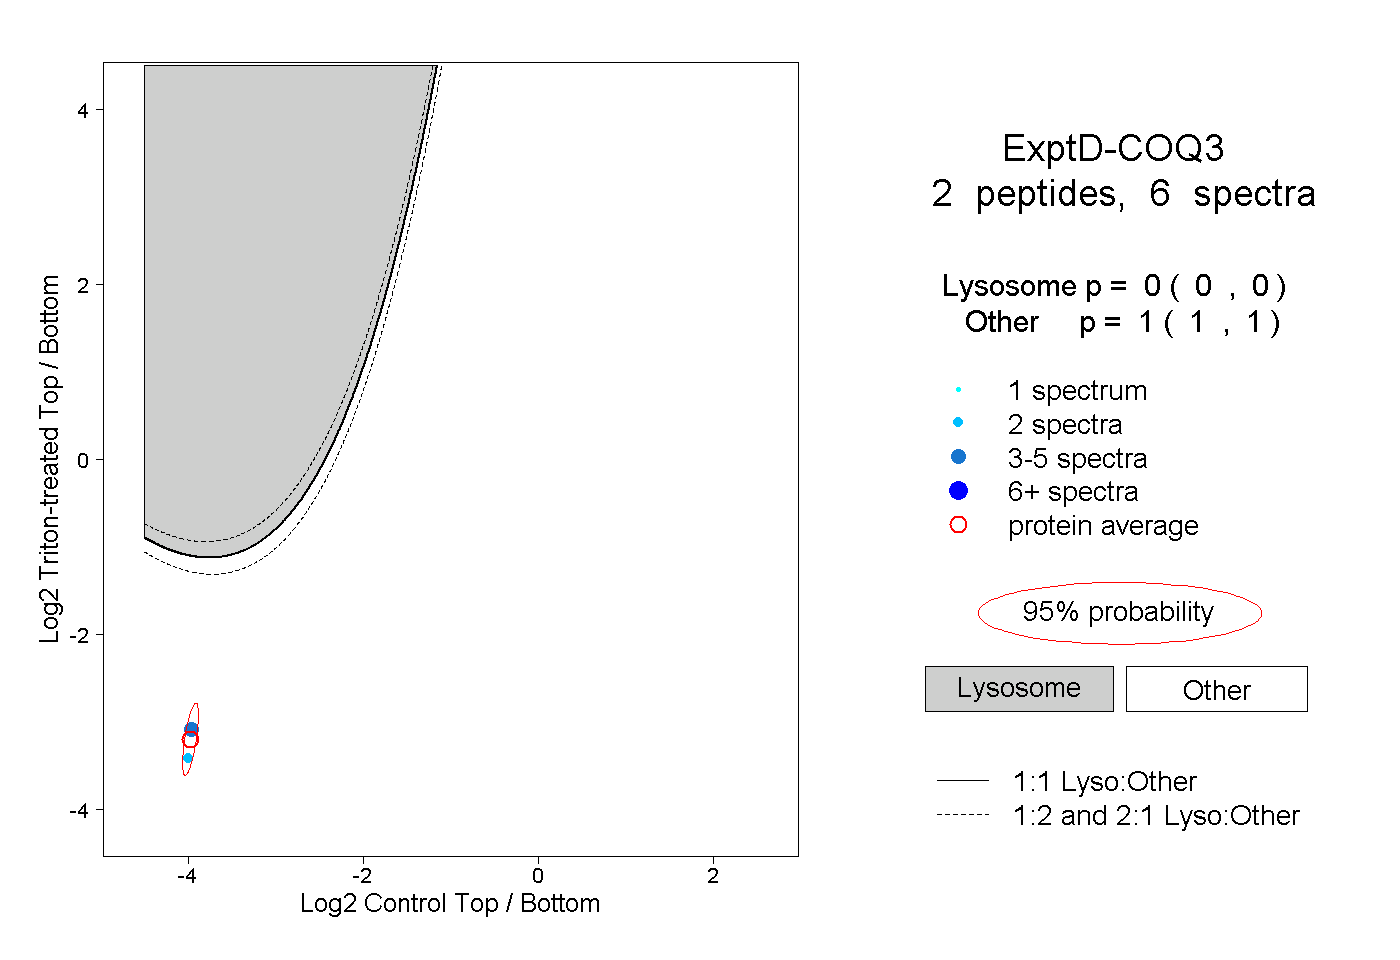 |
0.000 0.000 | 0.000 |
1.000 1.000 | 1.000 |