15
15peptides
spectra
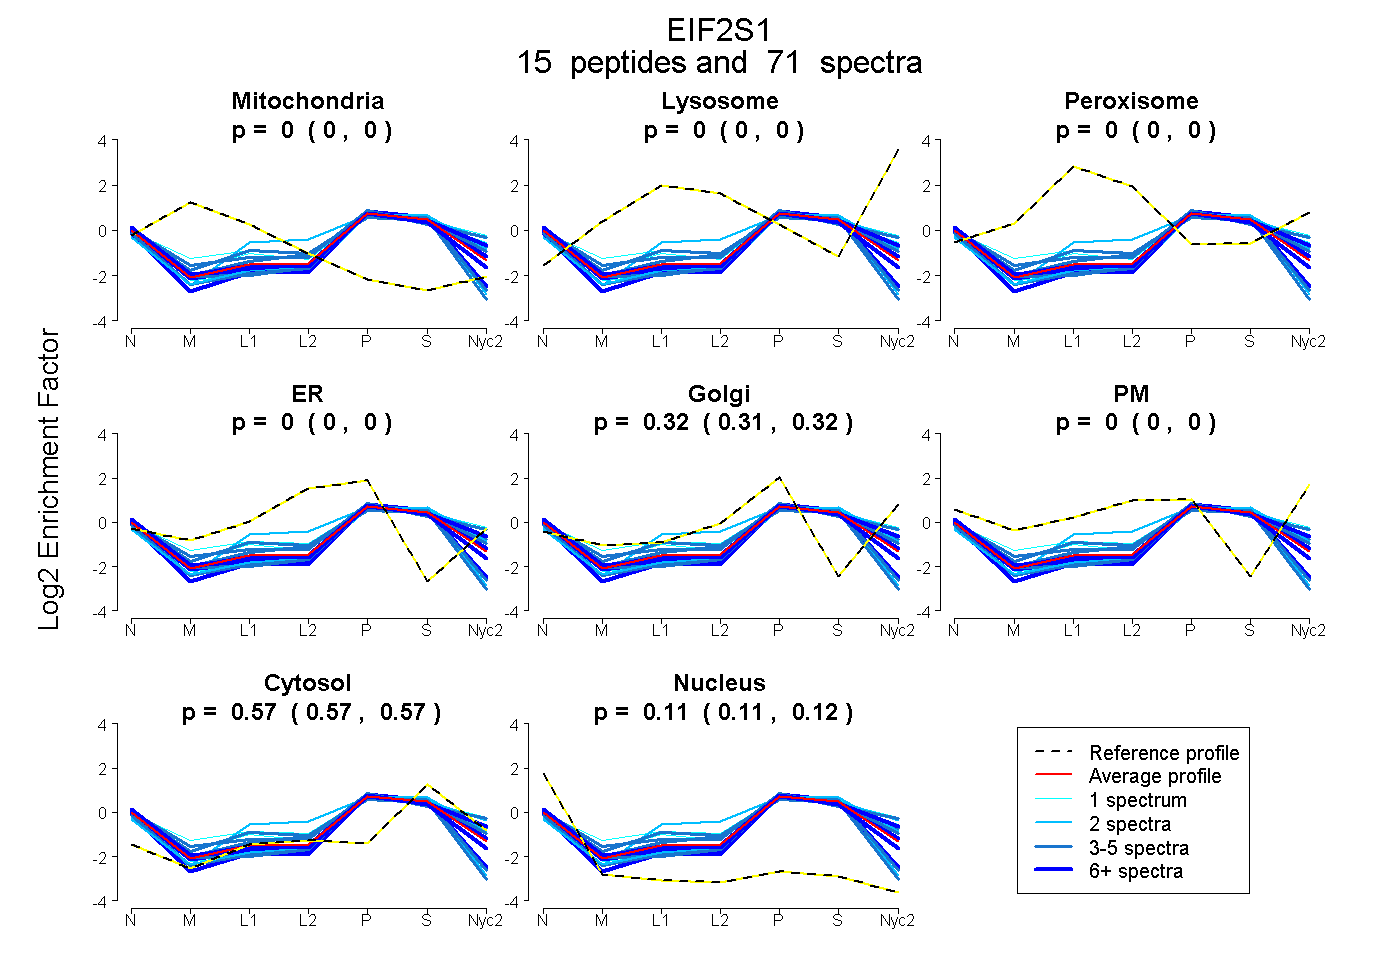
0.000 | 0.000
0.000 | 0.000
0.000 | 0.000
0.000 | 0.000
0.315 | 0.323
0.000 | 0.000
0.567 | 0.570
0.107 | 0.116
8peptides
spectra
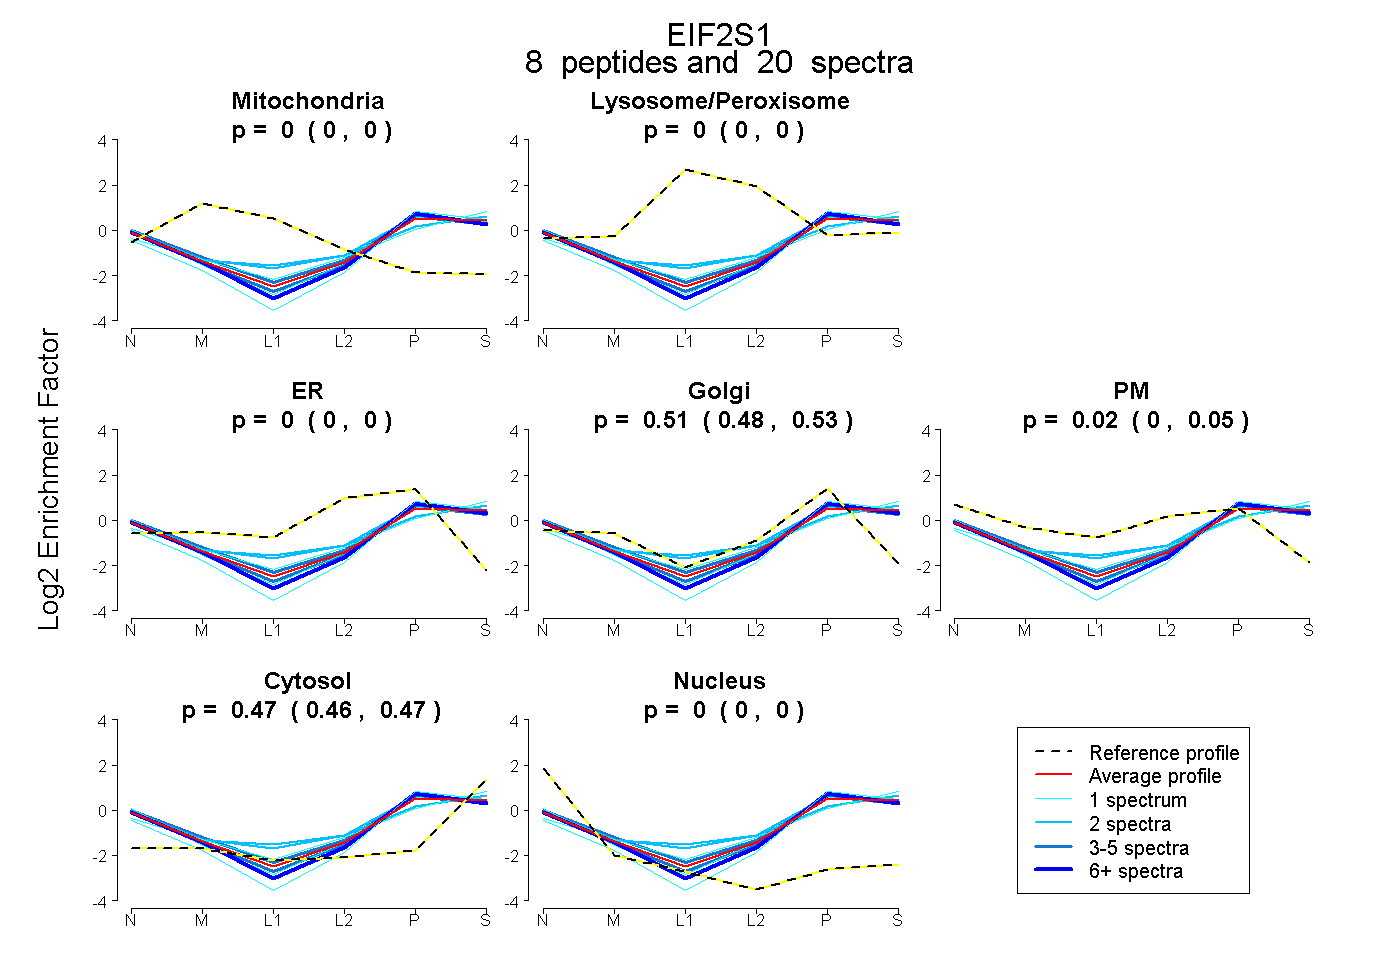
0.000 | 0.000
0.000 | 0.000
0.000 | 0.000
0.478 | 0.534
0.000 | 0.050
0.458 | 0.472
0.000 | 0.000