 1
1peptide
spectra
NA | NA
NA | NA
NA | NA
NA | NA
NA | NA
NA | NA
NA | NA
NA | NA
2peptides
spectra
0.002 | 0.574
0.425 | 0.998
| Plot | Mito | Lyso | Perox | ER | Golgi | PM | Cytosol | Nucleus | |||||
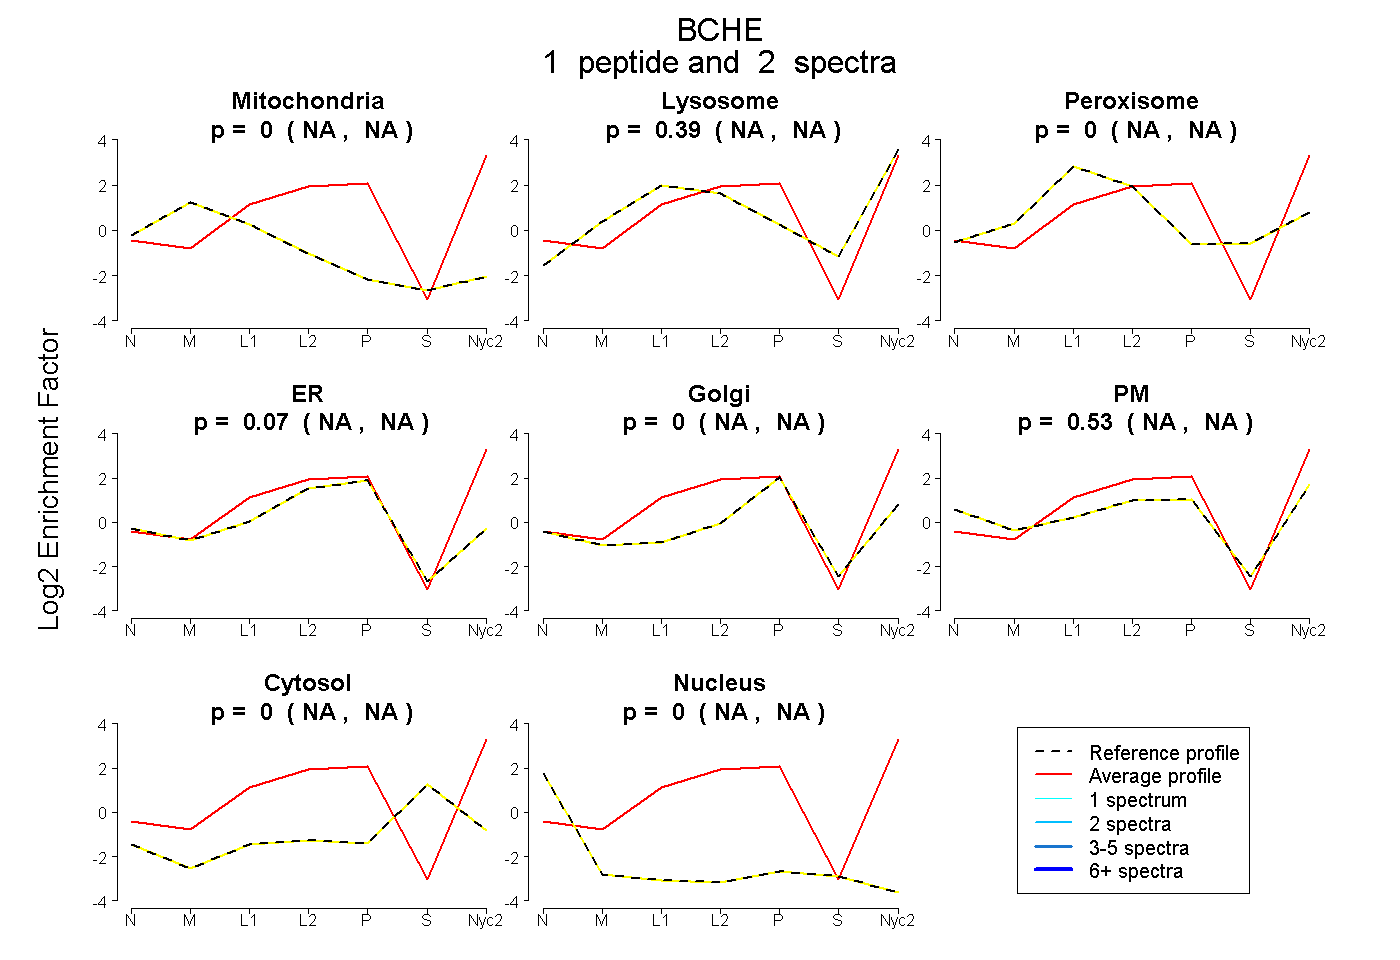
| Expt A |
1 peptide |
2 spectra |
|
0.000 NA | NA |
0.393 NA | NA |
0.000 NA | NA |
0.073 NA | NA |
0.000 NA | NA |
0.534 NA | NA |
0.000 NA | NA |
0.000 NA | NA |
||
| Plot | Lyso | Other | |||||||||||
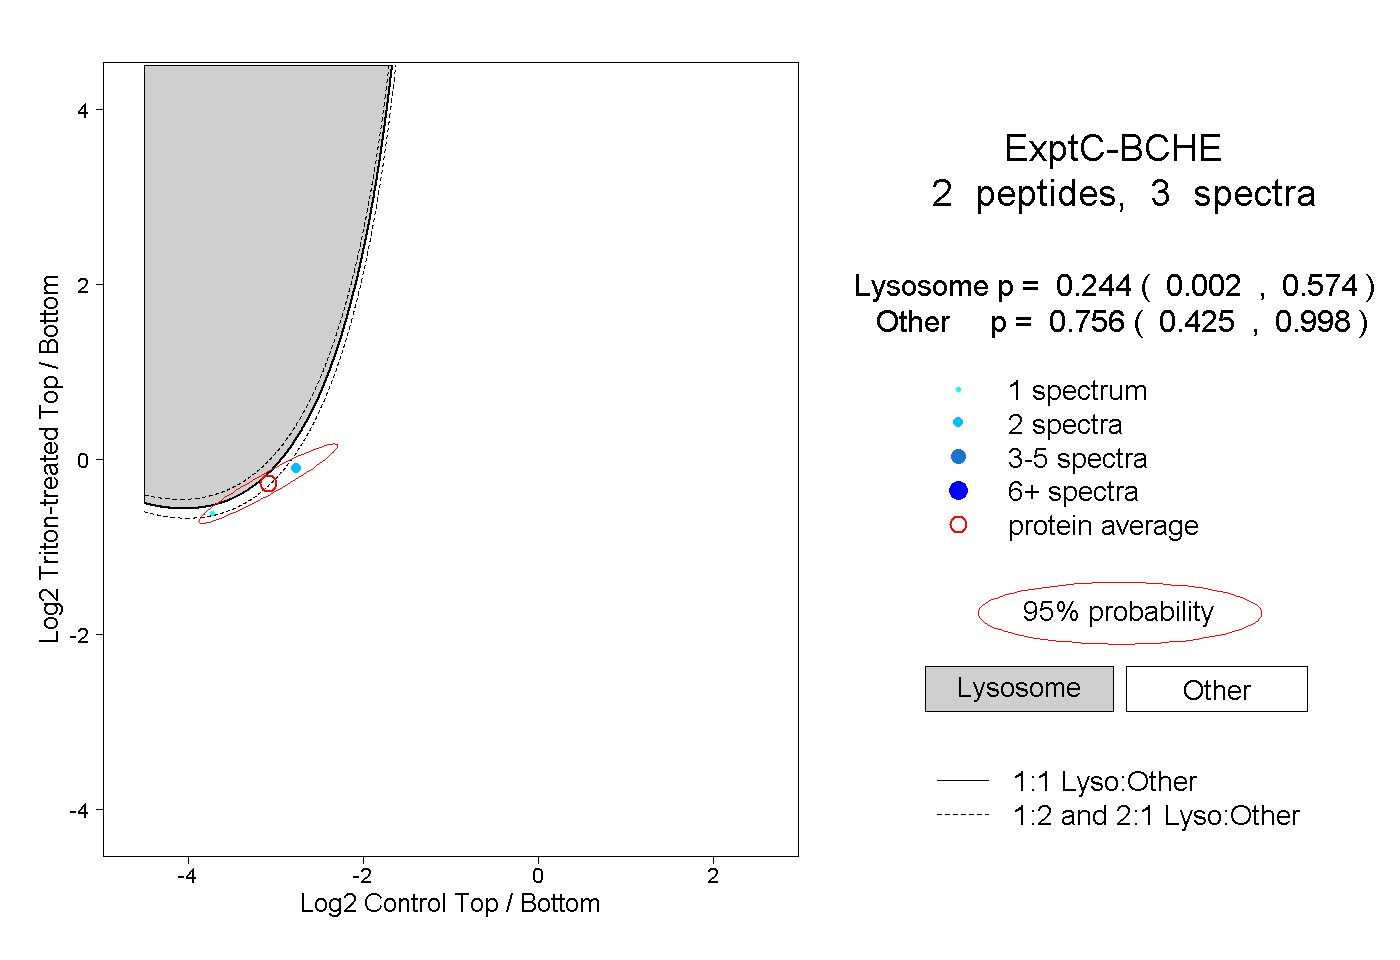
| Expt C |
2 peptides |
3 spectra |
|
0.244 0.002 | 0.574 |
0.756 0.425 | 0.998 |
| 1 spectrum, LVLPSDSIR | 0.266 | 0.734 | ||||||||
| 2 spectra, AEEIFSR | 0.047 | 0.953 |