 5
5peptides
spectra
0.000 | 0.000
0.000 | 0.000
0.000 | 0.000
0.000 | 0.000
0.190 | 0.229
0.006 | 0.050
0.753 | 0.764
0.000 | 0.000
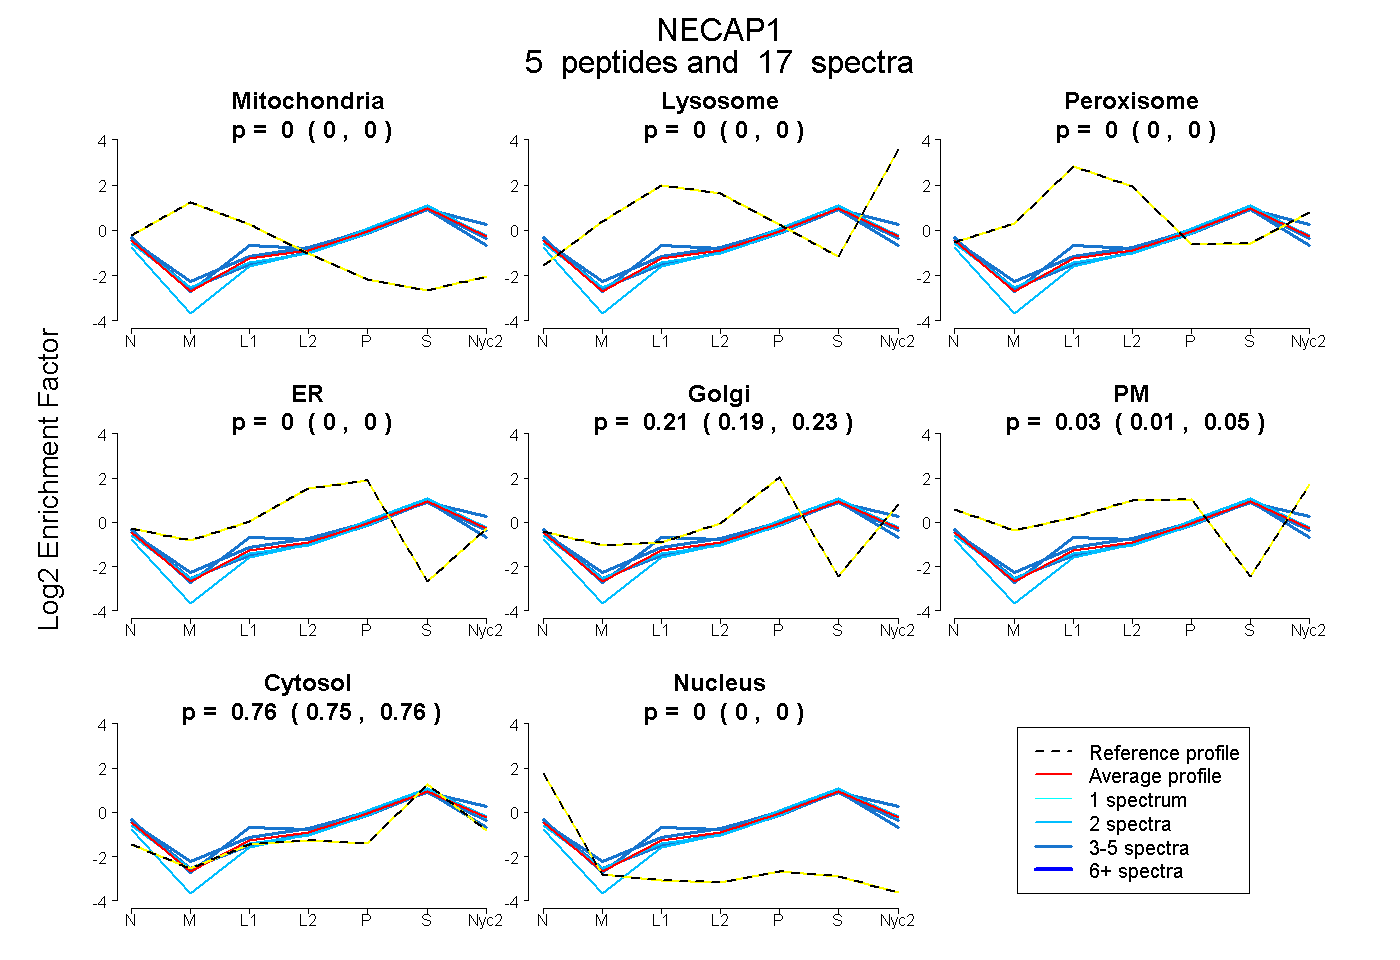
| Plot | Mito | Lyso | Perox | ER | Golgi | PM | Cytosol | Nucleus | |||||
| Expt A |
5 peptides |
17 spectra |
|
0.000 0.000 | 0.000 |
0.000 0.000 | 0.000 |
0.000 0.000 | 0.000 |
0.000 0.000 | 0.000 |
0.211 0.190 | 0.229 |
0.030 0.006 | 0.050 |
0.759 0.753 | 0.764 |
0.000 0.000 | 0.000 |
| 2 spectra, LDQPDWTGR | 0.000 | 0.000 | 0.000 | 0.000 | 0.174 | 0.000 | 0.826 | 0.000 | ||
| 4 spectra, ESQEMDSRPK | 0.000 | 0.000 | 0.000 | 0.000 | 0.209 | 0.000 | 0.768 | 0.023 | ||
| 4 spectra, LDLGFK | 0.000 | 0.000 | 0.000 | 0.019 | 0.163 | 0.087 | 0.731 | 0.000 | ||
| 5 spectra, IQDGTGR | 0.000 | 0.000 | 0.000 | 0.000 | 0.036 | 0.245 | 0.719 | 0.000 | ||
| 2 spectra, SAFIGIGFTDR | 0.000 | 0.000 | 0.000 | 0.000 | 0.220 | 0.002 | 0.778 | 0.000 |
| Plot | Mito | Lyso or Perox | ER | Golgi | PM | Cytosol | Nucleus | ||||||
| Expt B |
1 peptide |
1 spectrum |
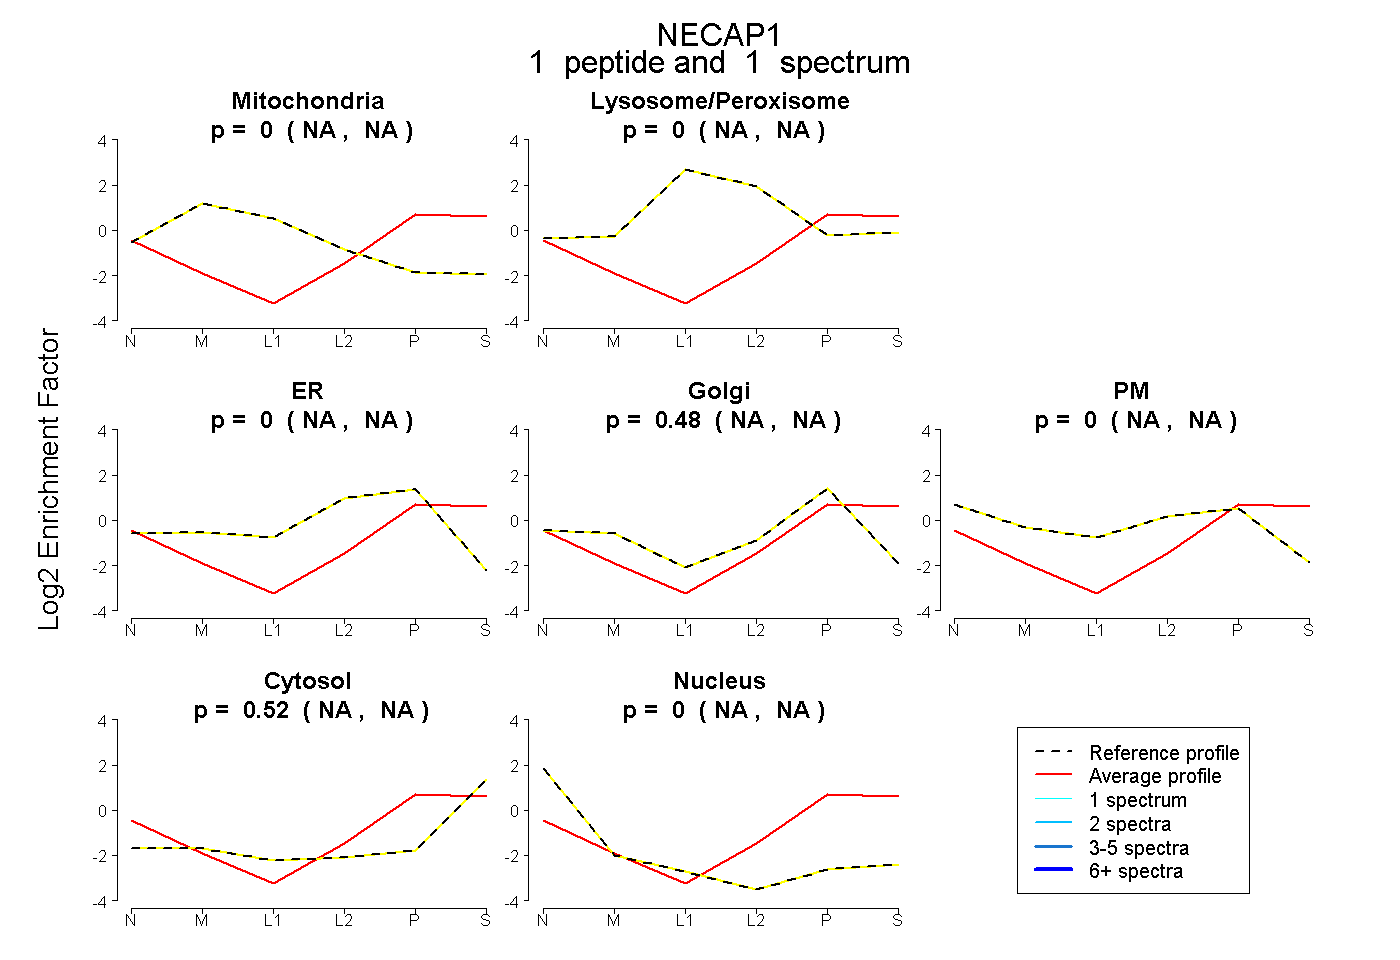 |
0.000 NA | NA |
0.000 NA | NA |
0.000 NA | NA |
0.483 NA | NA |
0.000 NA | NA |
0.517 NA | NA |
0.000 NA | NA |
|||
| Plot | Lyso | Other | |||||||||||
| Expt C |
4 peptides |
24 spectra |
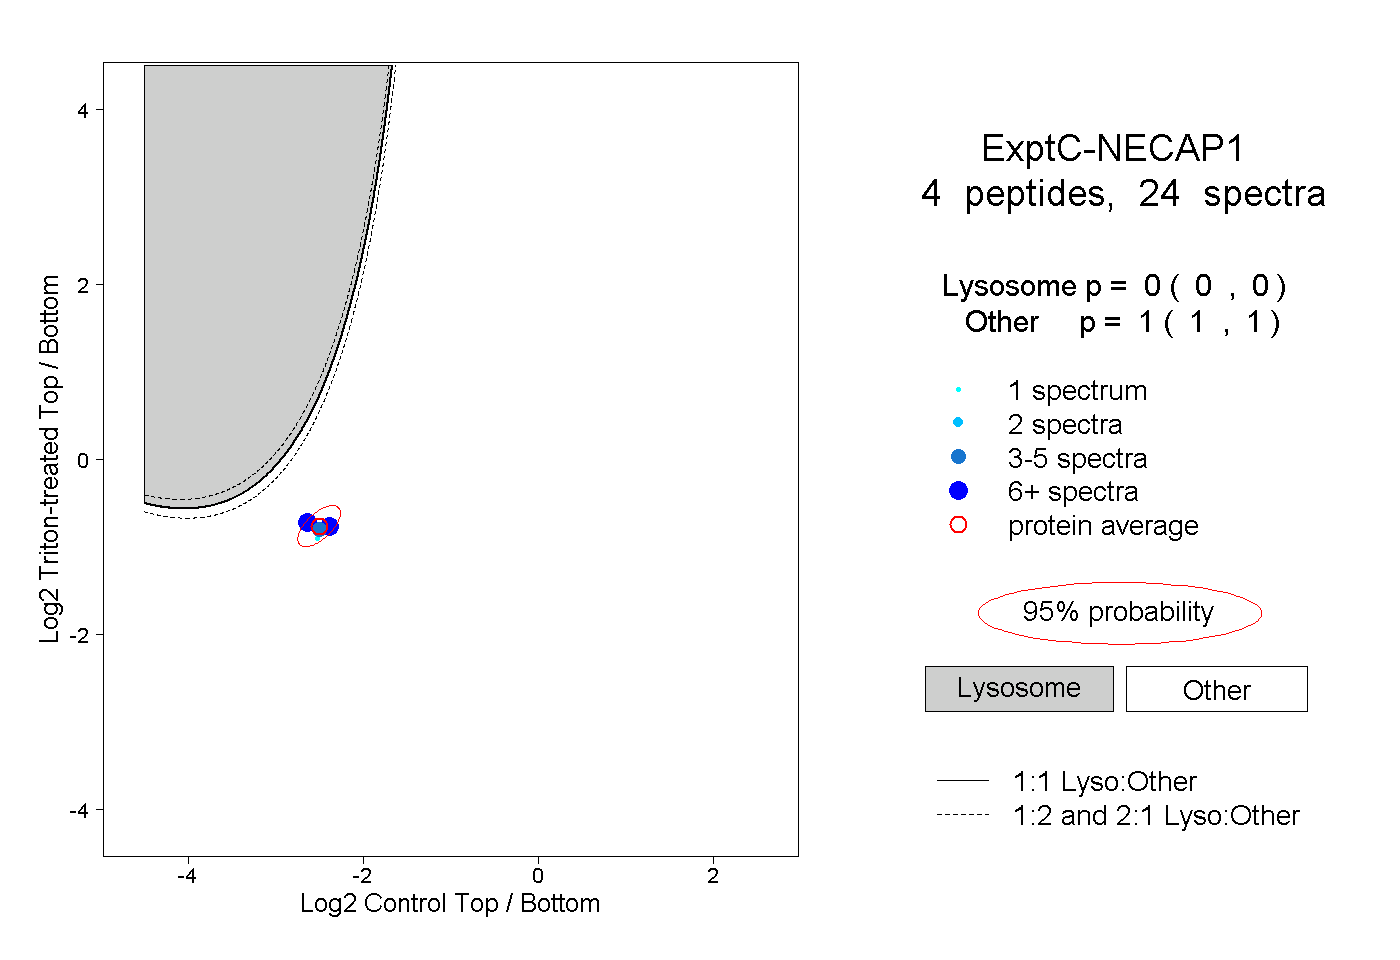 |
0.000 0.000 | 0.000 |
1.000 1.000 | 1.000 |