 7
7peptides
spectra

0.000 | 0.000
0.206 | 0.299
0.000 | 0.062
0.272 | 0.378
0.000 | 0.000
0.050 | 0.186
0.241 | 0.275
0.000 | 0.000
2peptides
spectra

NA | NA
NA | NA
NA | NA
NA | NA
NA | NA
NA | NA
NA | NA
| Plot | Mito | Lyso | Perox | ER | Golgi | PM | Cytosol | Nucleus | |||||
| Expt A |
7 peptides |
10 spectra |
|
0.000 0.000 | 0.000 |
0.257 0.206 | 0.299 |
0.028 0.000 | 0.062 |
0.332 0.272 | 0.378 |
0.000 0.000 | 0.000 |
0.123 0.050 | 0.186 |
0.260 0.241 | 0.275 |
0.000 0.000 | 0.000 |
||
| Plot | Mito | Lyso or Perox | ER | Golgi | PM | Cytosol | Nucleus | ||||||
| Expt B |
2 peptides |
2 spectra |
|
0.000 NA | NA |
0.421 NA | NA |
0.245 NA | NA |
0.242 NA | NA |
0.000 NA | NA |
0.092 NA | NA |
0.000 NA | NA |
| 1 spectrum, TTDVTQTFAIEK | 0.000 | 0.493 | 0.060 | 0.336 | 0.000 | 0.111 | 0.000 | |||
| 1 spectrum, TFLRPR | 0.000 | 0.349 | 0.429 | 0.149 | 0.000 | 0.074 | 0.000 |
| Plot | Lyso | Other | |||||||||||
| Expt C |
7 peptides |
16 spectra |
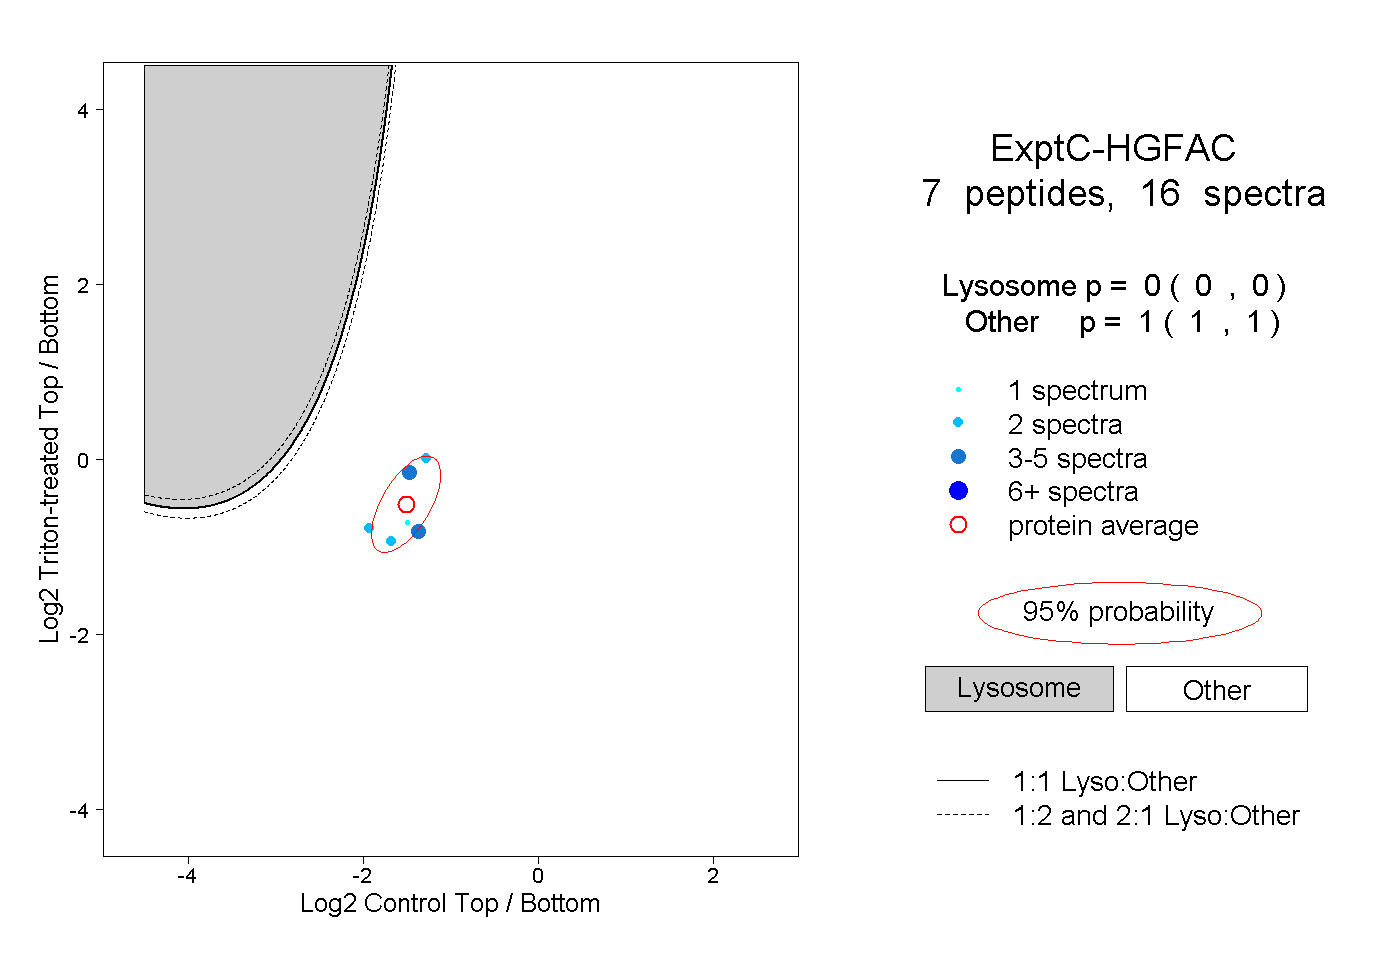 |
0.000 0.000 | 0.000 |
1.000 1.000 | 1.000 |
||||||||
| Plot | Lyso | Other | |||||||||||
| Expt D |
2 peptides |
2 spectra |
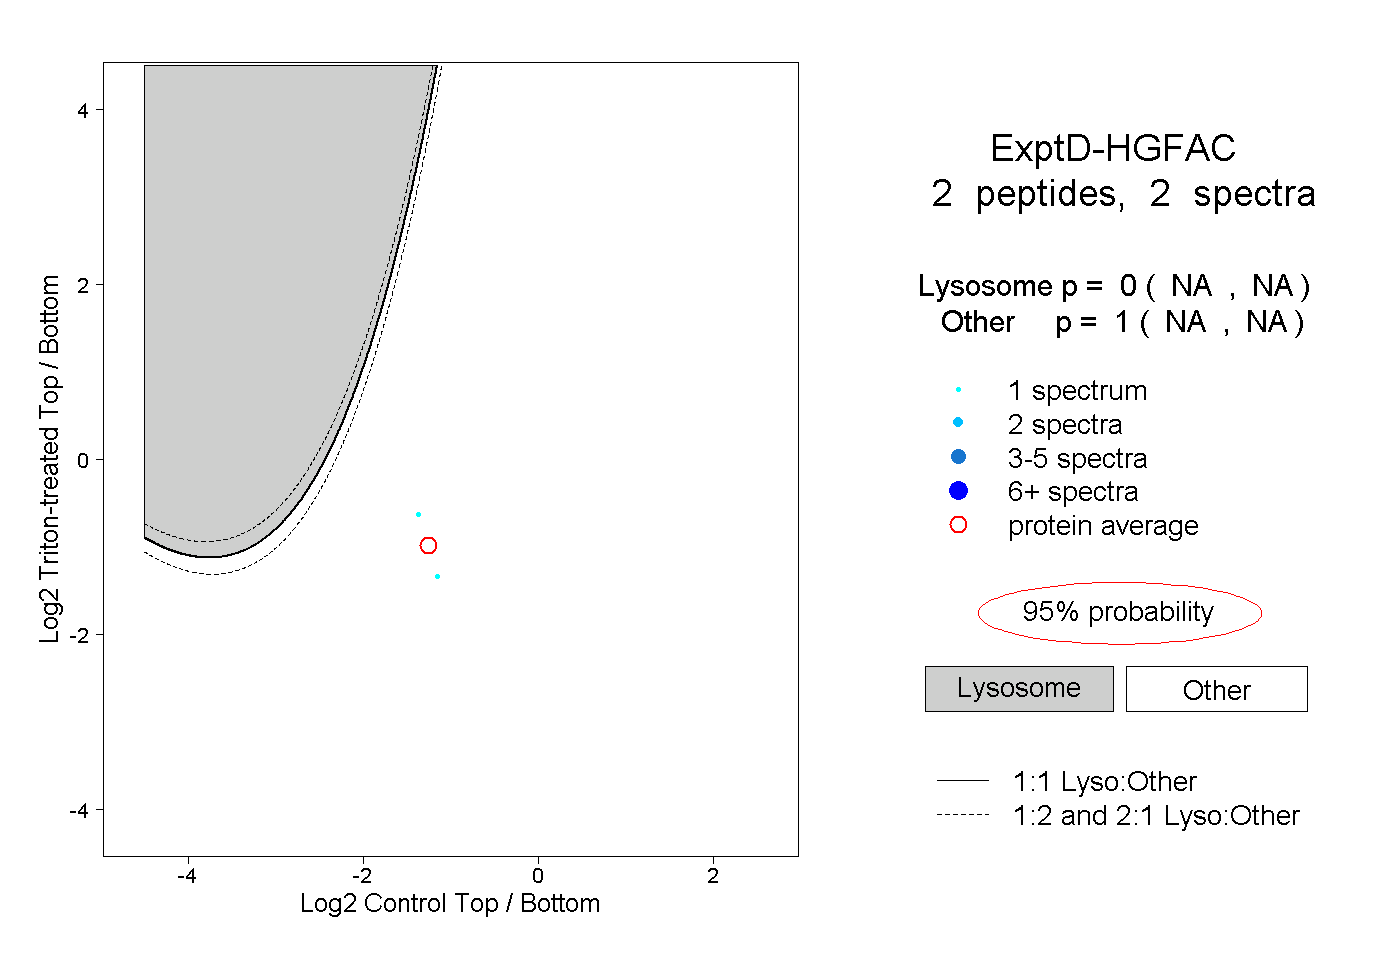 |
0.000 NA | NA |
1.000 NA | NA |