 7
7peptides
spectra

0.000 | 0.000
0.206 | 0.299
0.000 | 0.062
0.272 | 0.378
0.000 | 0.000
0.050 | 0.186
0.241 | 0.275
0.000 | 0.000
| Plot | Mito | Lyso | Perox | ER | Golgi | PM | Cytosol | Nucleus | |||||
| Expt A |
7 peptides |
10 spectra |
|
0.000 0.000 | 0.000 |
0.257 0.206 | 0.299 |
0.028 0.000 | 0.062 |
0.332 0.272 | 0.378 |
0.000 0.000 | 0.000 |
0.123 0.050 | 0.186 |
0.260 0.241 | 0.275 |
0.000 0.000 | 0.000 |
| 2 spectra, YEYFEVGDHWAR | 0.000 | 0.249 | 0.168 | 0.101 | 0.162 | 0.113 | 0.208 | 0.000 | ||
| 1 spectrum, SDACQGDSGGPLVCEK | 0.000 | 0.000 | 0.000 | 0.064 | 0.000 | 0.697 | 0.193 | 0.047 | ||
| 1 spectrum, FCNIVPTER | 0.000 | 0.006 | 0.499 | 0.096 | 0.284 | 0.000 | 0.115 | 0.000 | ||
| 2 spectra, VSNYVDWINDR | 0.000 | 0.457 | 0.000 | 0.137 | 0.152 | 0.037 | 0.216 | 0.000 | ||
| 1 spectrum, DCGTEK | 0.000 | 0.247 | 0.000 | 0.279 | 0.000 | 0.000 | 0.474 | 0.000 | ||
| 2 spectra, DSALSWEYCR | 0.000 | 0.108 | 0.123 | 0.518 | 0.000 | 0.000 | 0.251 | 0.000 | ||
| 1 spectrum, TFLRPR | 0.000 | 0.399 | 0.000 | 0.435 | 0.026 | 0.000 | 0.140 | 0.000 |
| Plot | Mito | Lyso or Perox | ER | Golgi | PM | Cytosol | Nucleus | ||||||
| Expt B |
2 peptides |
2 spectra |
 |
0.000 NA | NA |
0.421 NA | NA |
0.245 NA | NA |
0.242 NA | NA |
0.000 NA | NA |
0.092 NA | NA |
0.000 NA | NA |
|||
| Plot | Lyso | Other | |||||||||||
| Expt C |
7 peptides |
16 spectra |
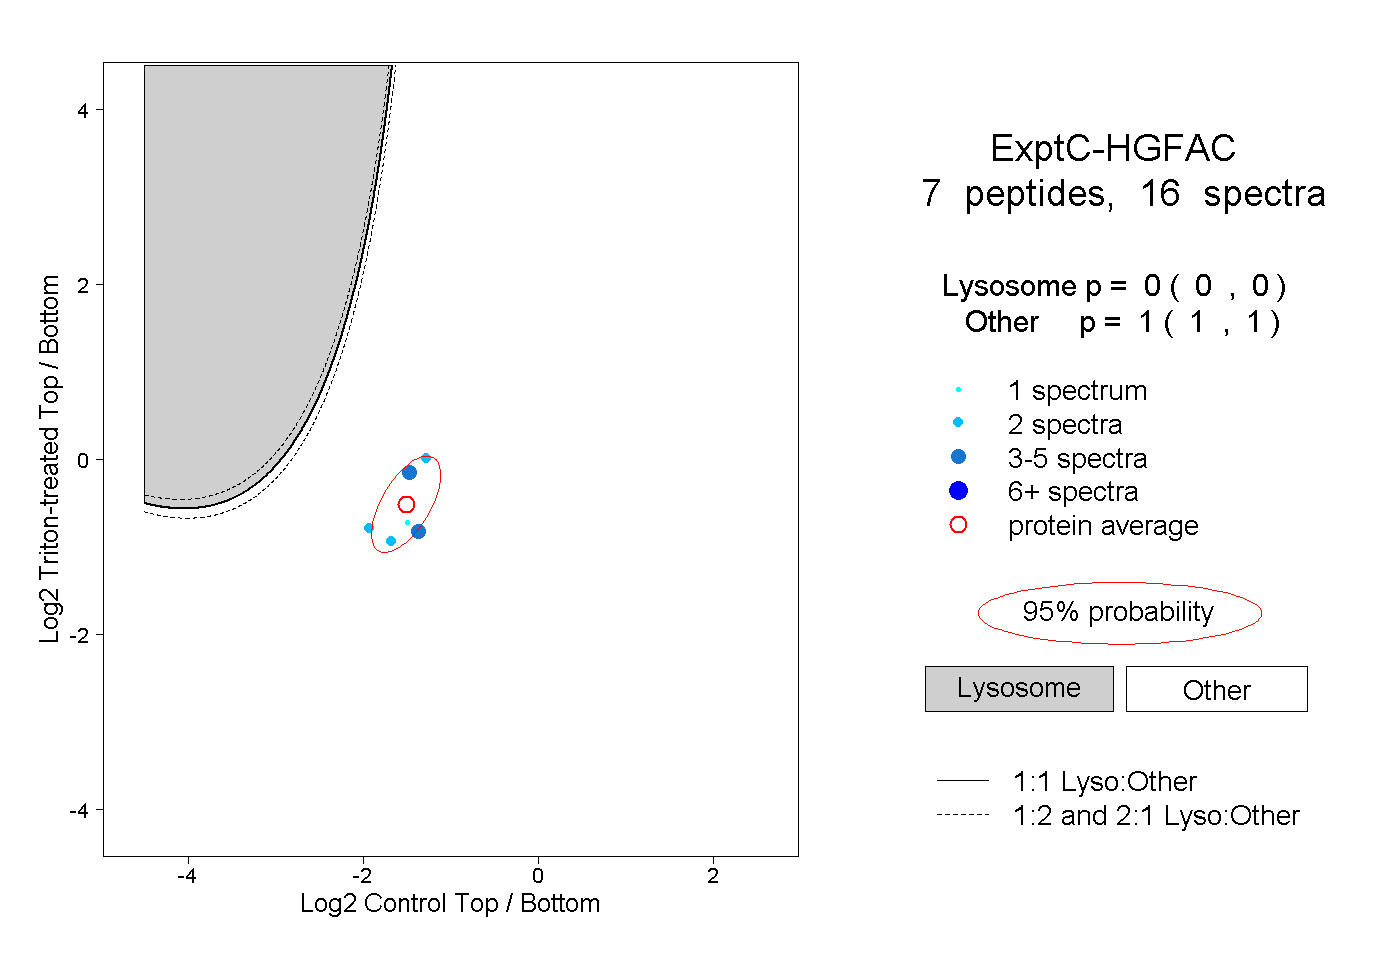 |
0.000 0.000 | 0.000 |
1.000 1.000 | 1.000 |
||||||||
| Plot | Lyso | Other | |||||||||||
| Expt D |
2 peptides |
2 spectra |
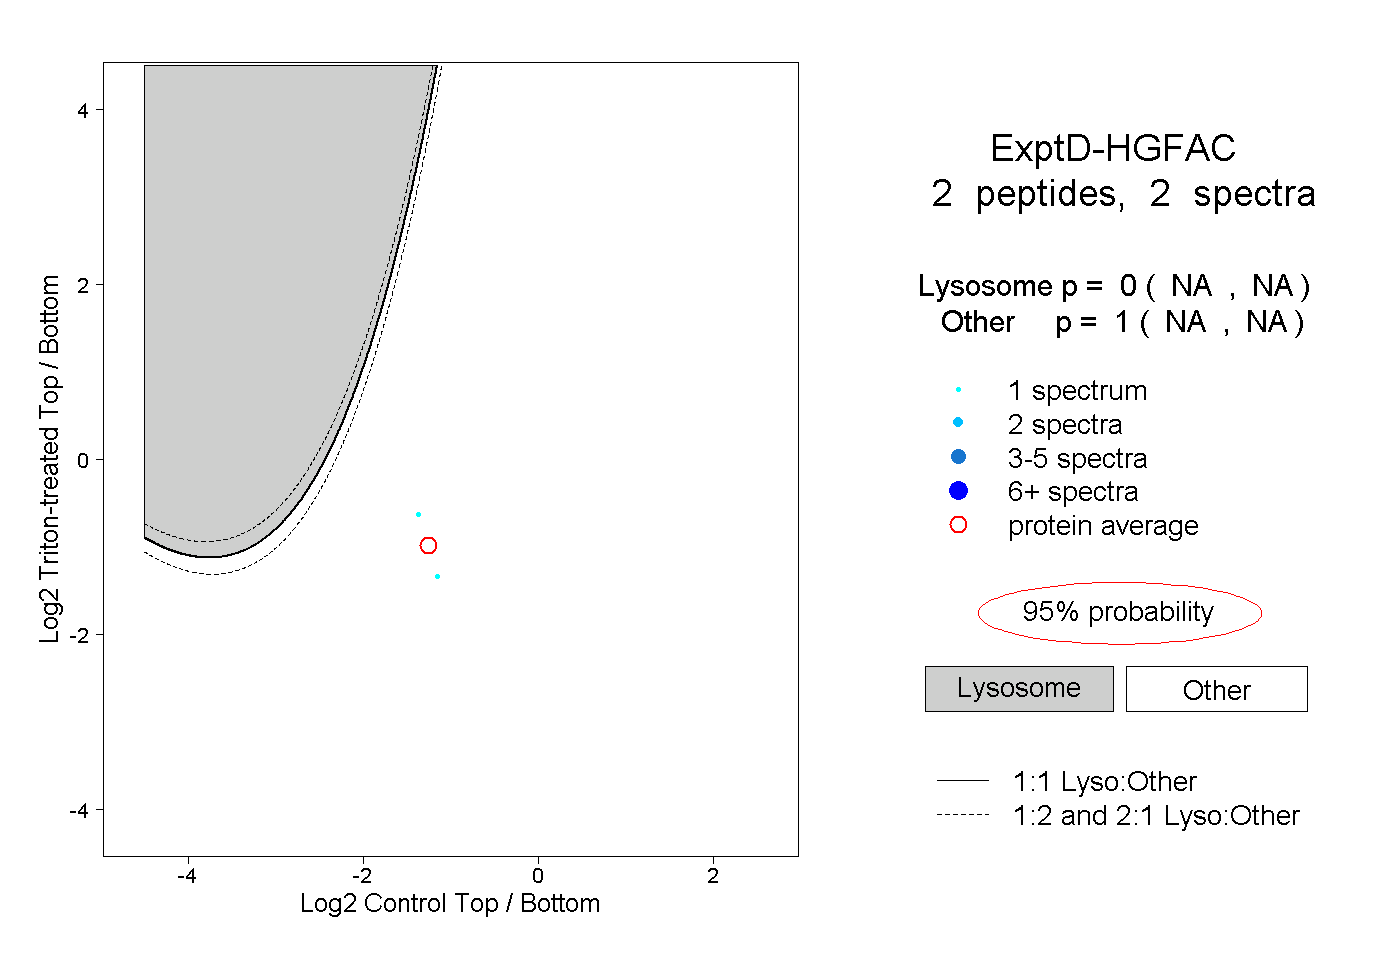 |
0.000 NA | NA |
1.000 NA | NA |