14
14peptides
spectra
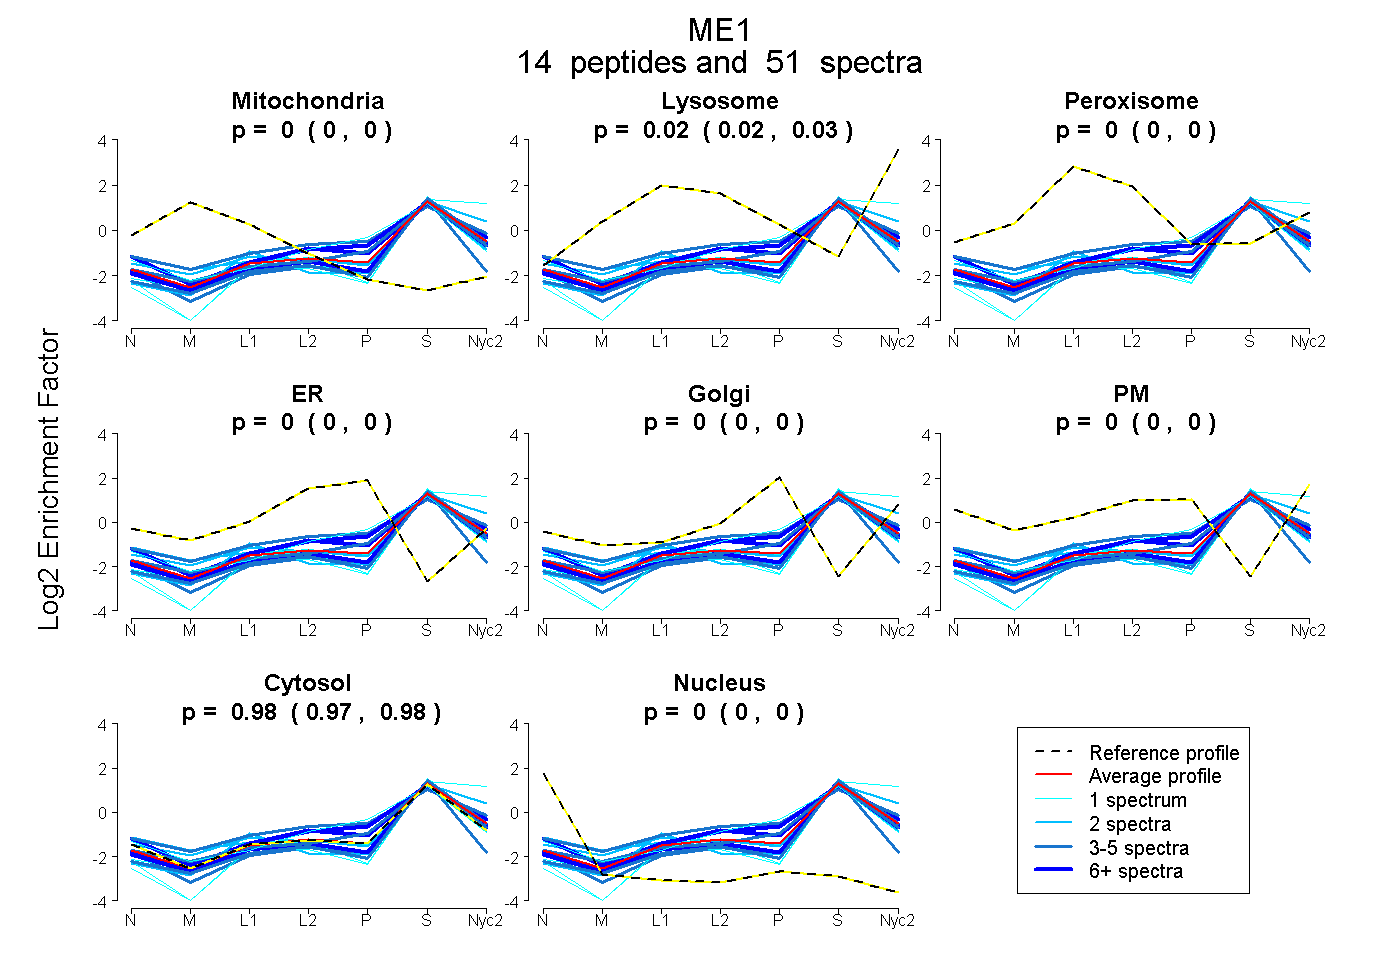
0.000 | 0.000
0.018 | 0.027
0.000 | 0.000
0.000 | 0.000
0.000 | 0.000
0.000 | 0.000
0.972 | 0.981
0.000 | 0.000
1peptide
spectra
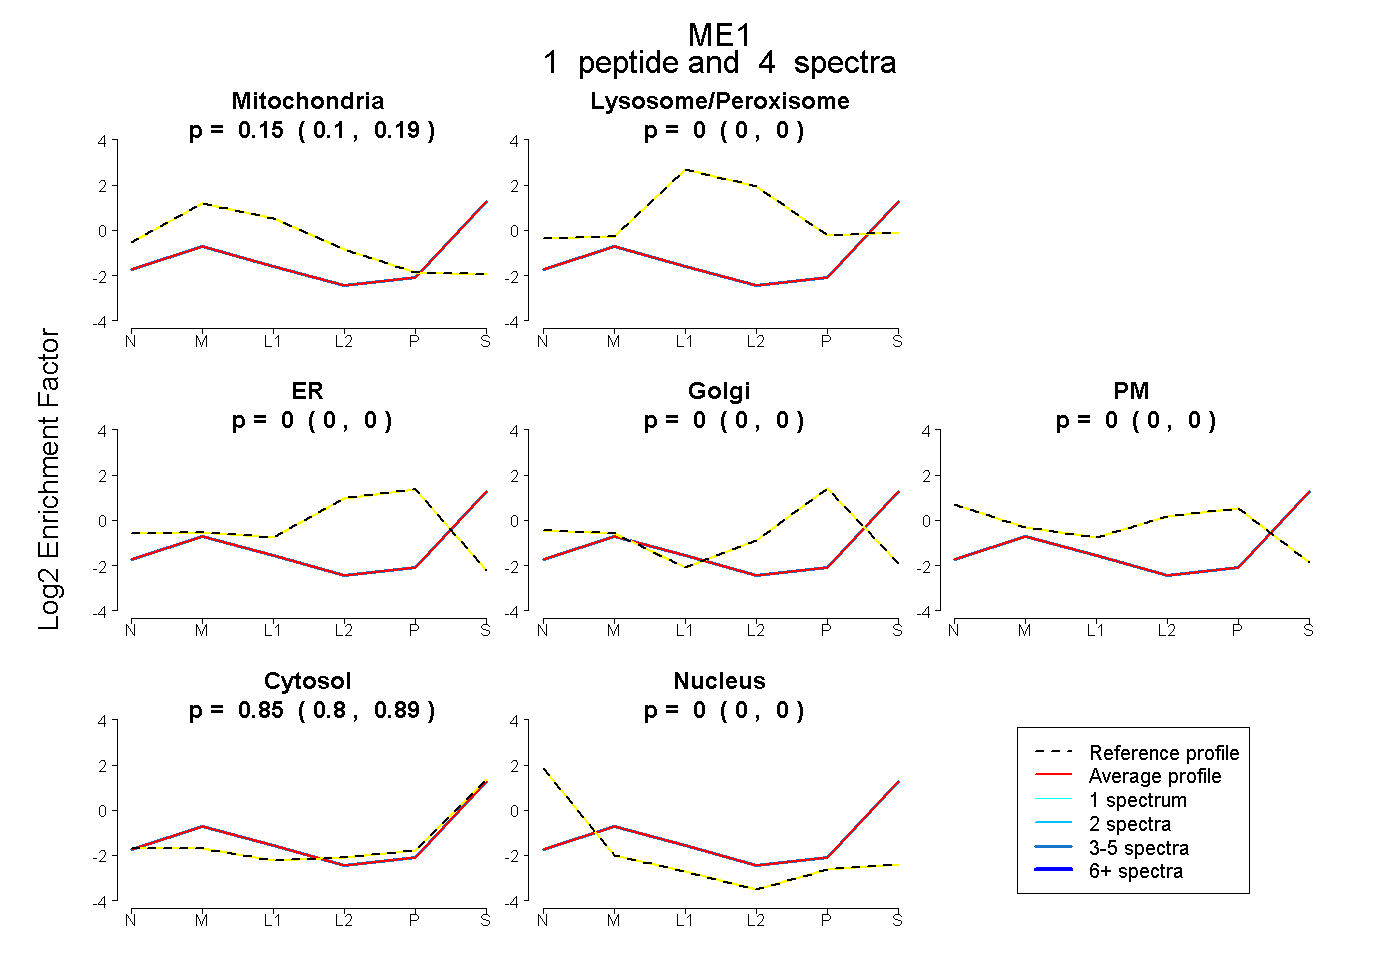
0.099 | 0.186
0.000 | 0.000
0.000 | 0.000
0.000 | 0.000
0.000 | 0.000
0.805 | 0.893
0.000 | 0.000
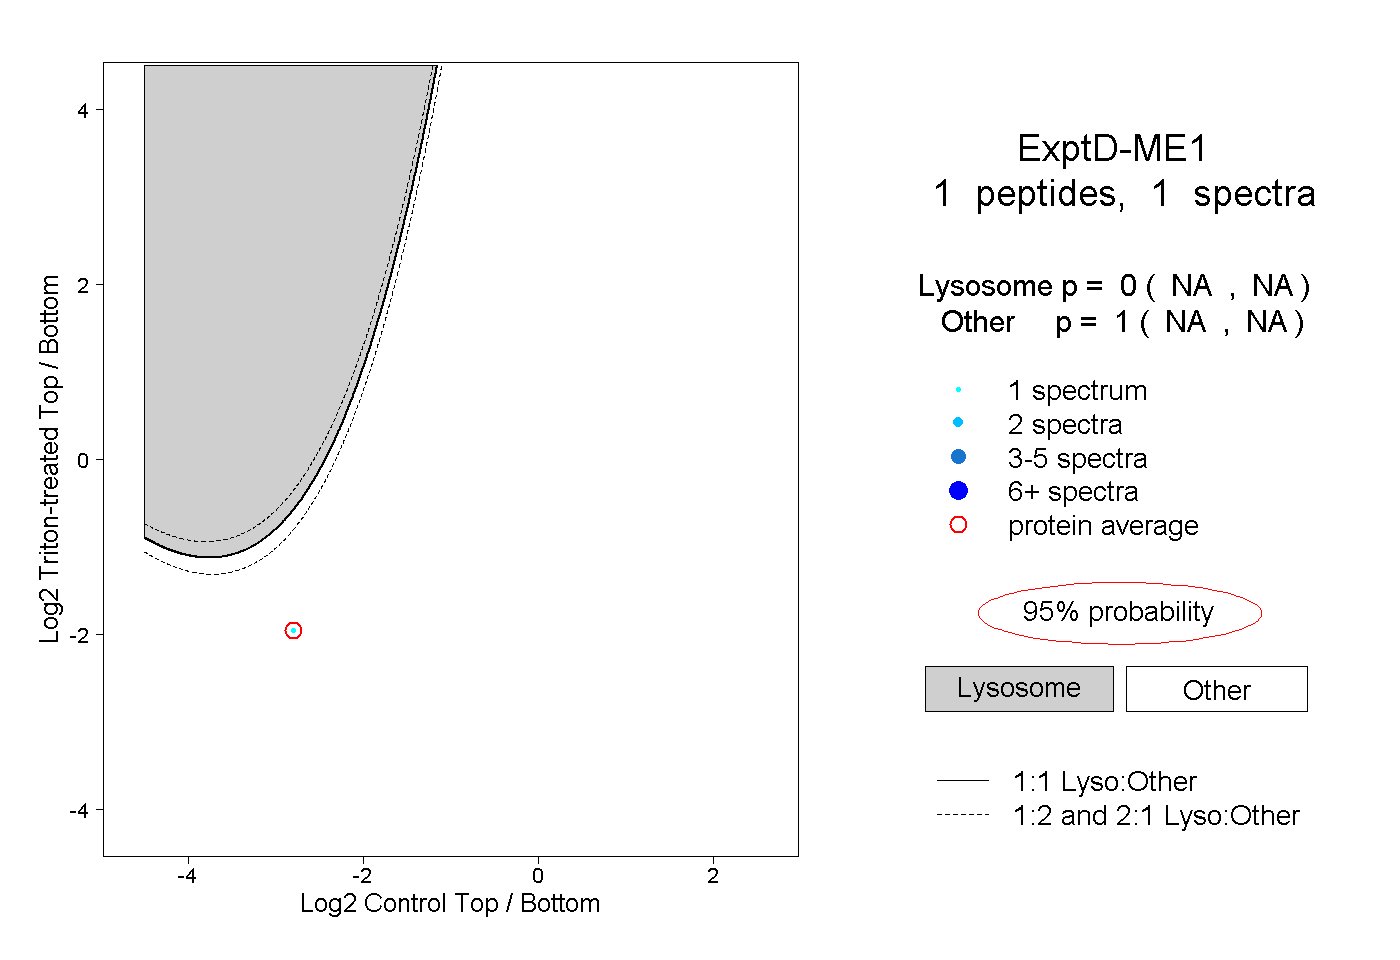
11peptides
spectra
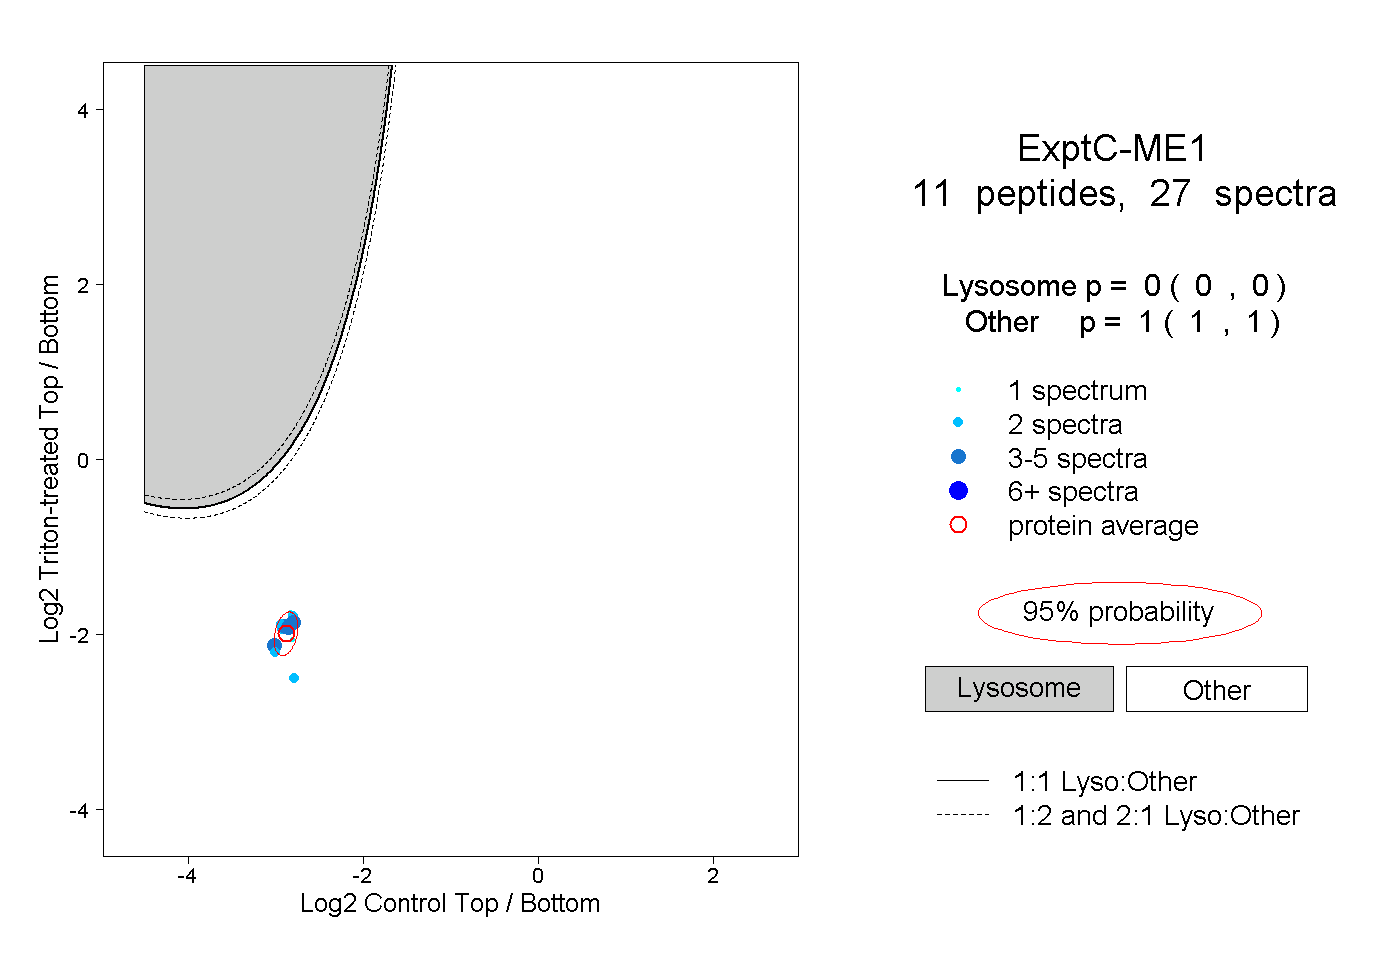
0.000 | 0.000
1.000 | 1.000