 3
3peptides
spectra
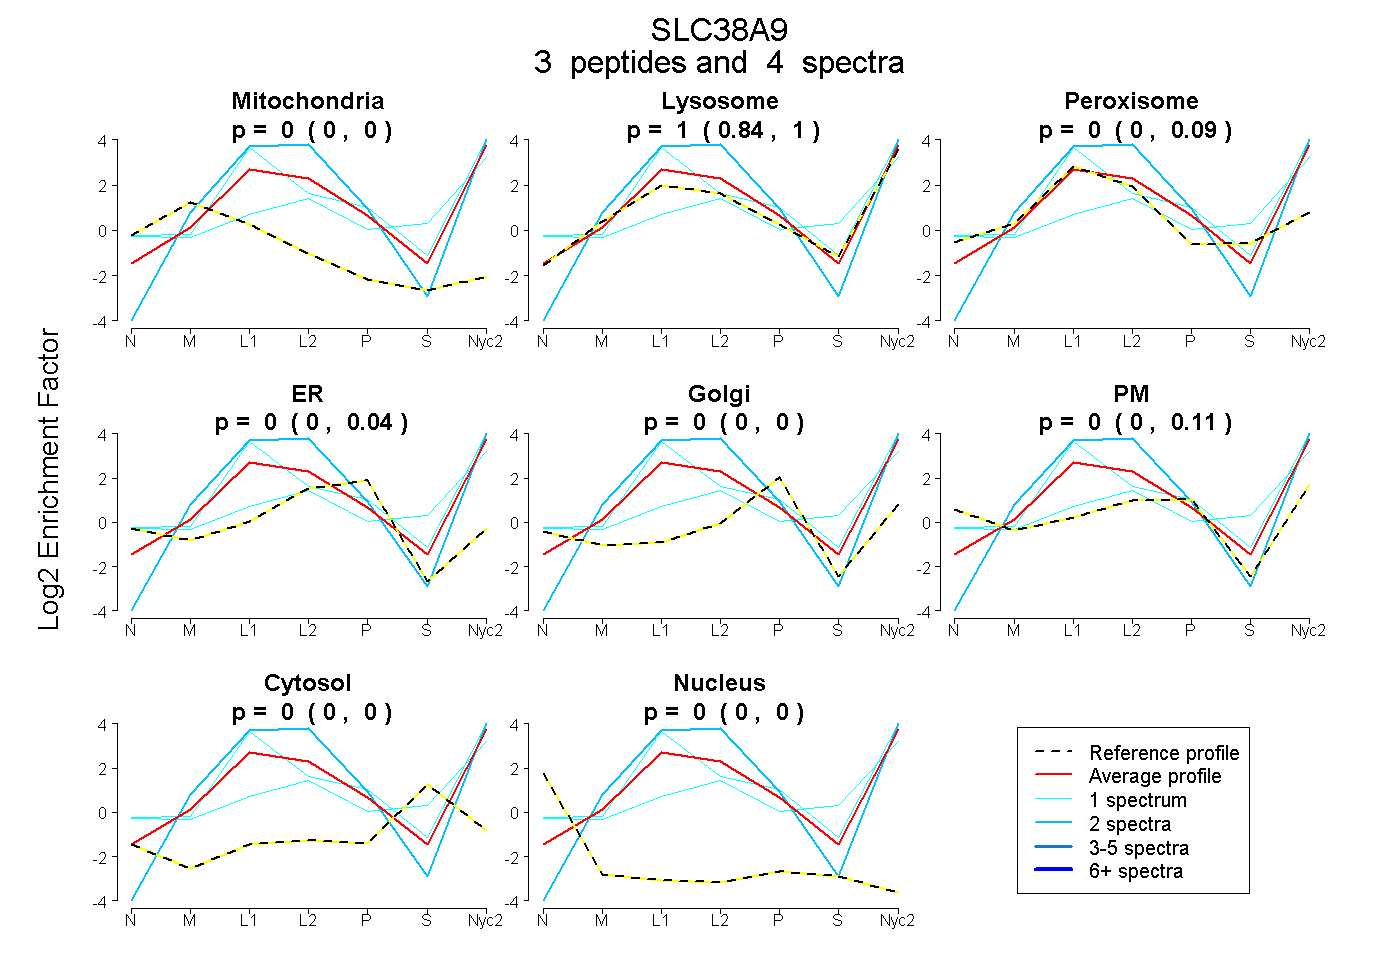
0.000 | 0.000
0.838 | 1.000
0.000 | 0.092
0.000 | 0.037
0.000 | 0.000
0.000 | 0.112
0.000 | 0.000
0.000 | 0.000
| Plot | Mito | Lyso | Perox | ER | Golgi | PM | Cytosol | Nucleus | |||||
| Expt A |
3 peptides |
4 spectra |
|
0.000 0.000 | 0.000 |
1.000 0.838 | 1.000 |
0.000 0.000 | 0.092 |
0.000 0.000 | 0.037 |
0.000 0.000 | 0.000 |
0.000 0.000 | 0.112 |
0.000 0.000 | 0.000 |
0.000 0.000 | 0.000 |
| 2 spectra, NQENNVR | 0.000 | 1.000 | 0.000 | 0.000 | 0.000 | 0.000 | 0.000 | 0.000 | ||
| 1 spectrum, SYTEGYR | 0.000 | 0.713 | 0.000 | 0.000 | 0.000 | 0.087 | 0.200 | 0.000 | ||
| 1 spectrum, IHYYSR | 0.000 | 0.911 | 0.089 | 0.000 | 0.000 | 0.000 | 0.000 | 0.000 |
| Plot | Lyso | Other | |||||||||||
| Expt C |
3 peptides |
11 spectra |
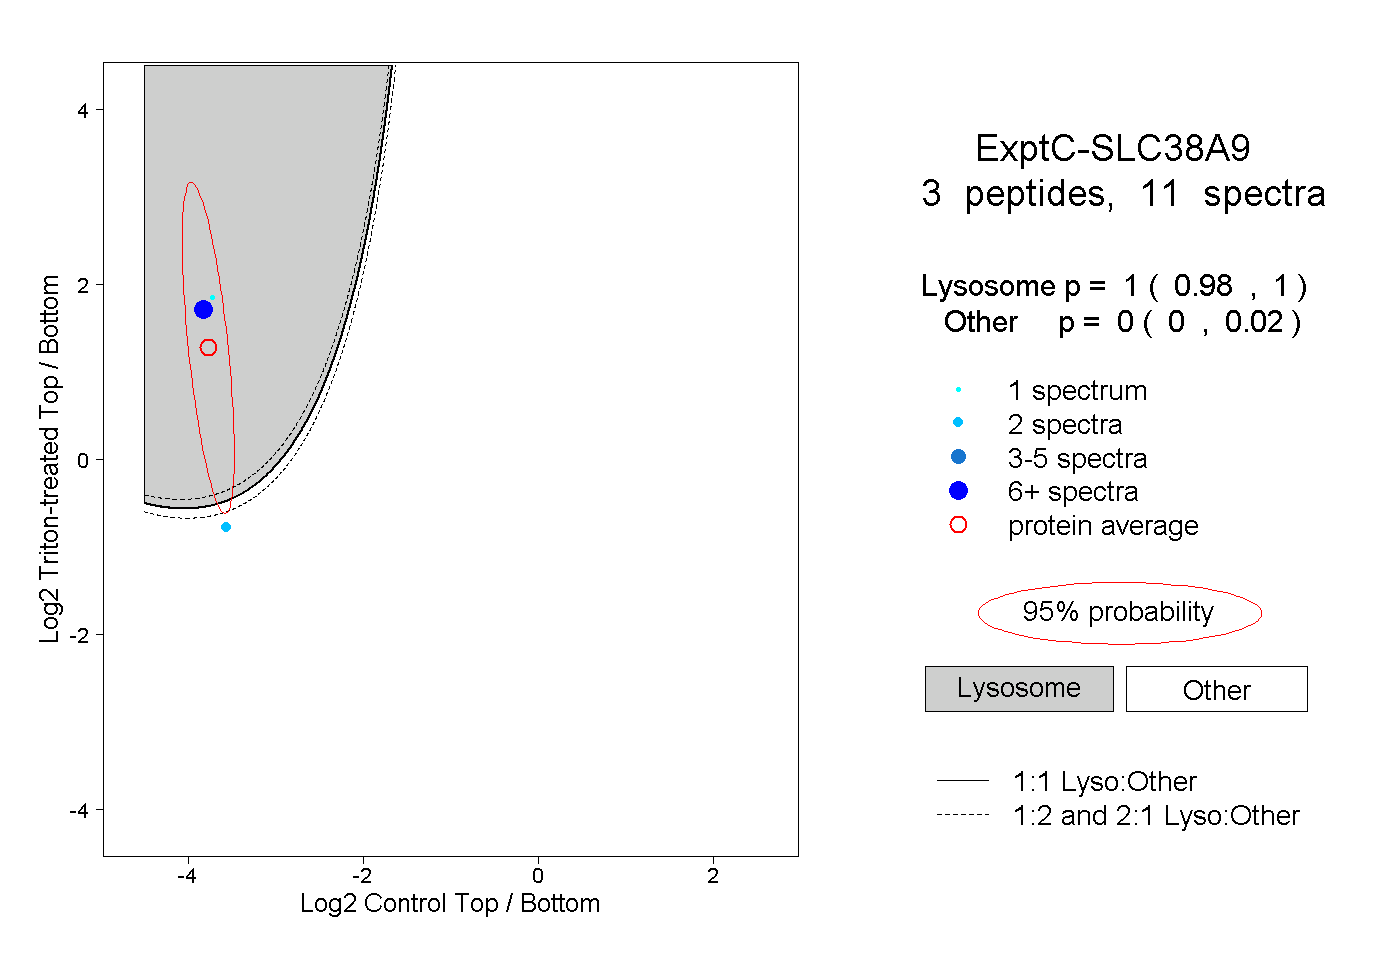 |
1.000 0.980 | 1.000 |
0.000 0.000 | 0.020 |