11
11peptides
spectra
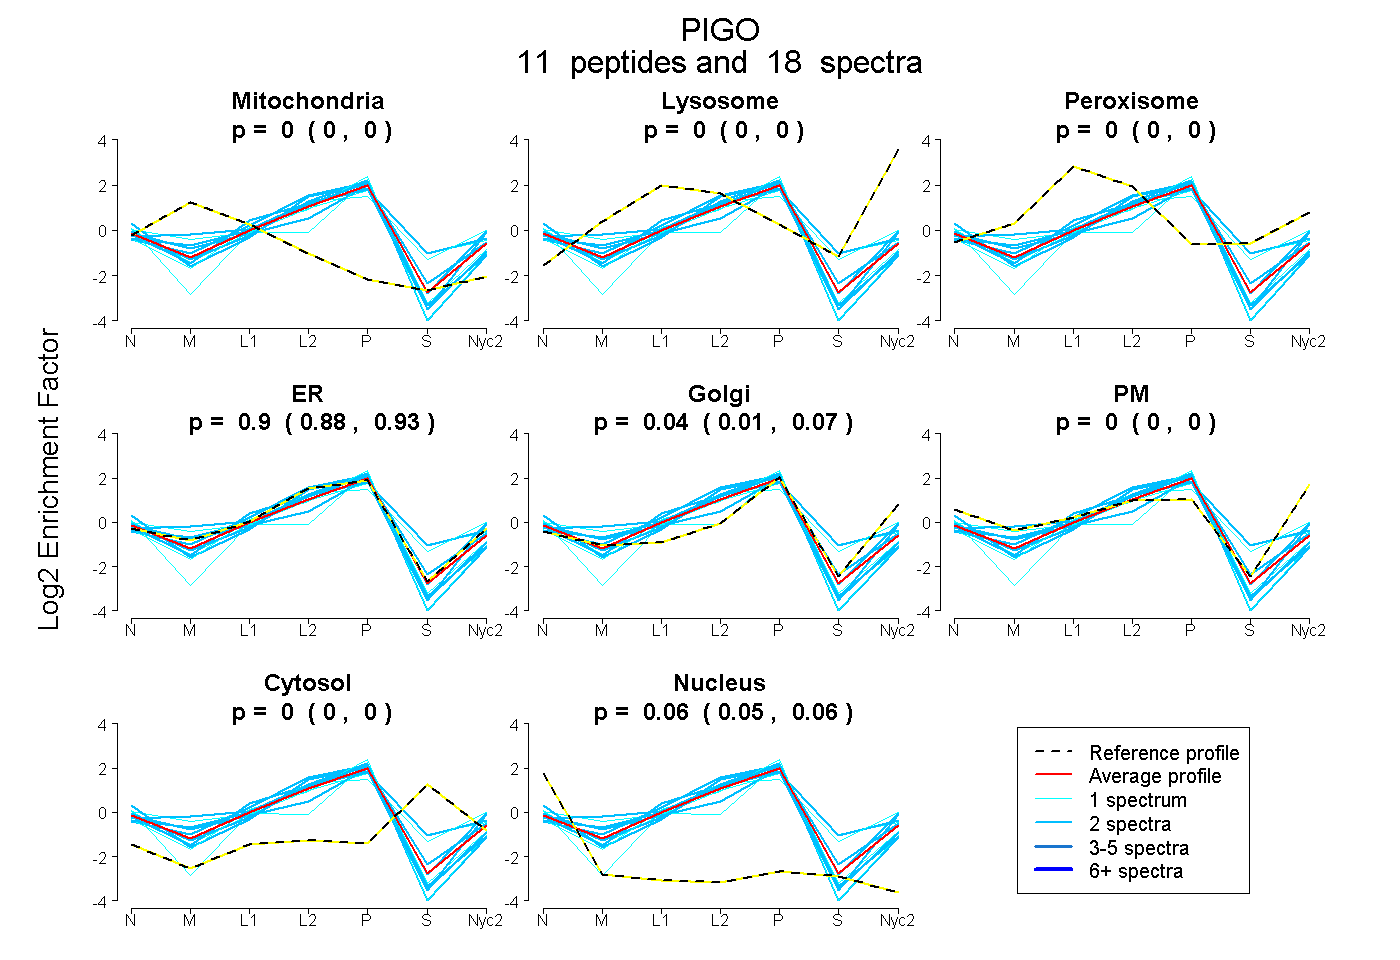
0.000 | 0.000
0.000 | 0.000
0.000 | 0.000
0.875 | 0.926
0.011 | 0.067
0.000 | 0.000
0.000 | 0.000
0.049 | 0.062
2peptides
spectra
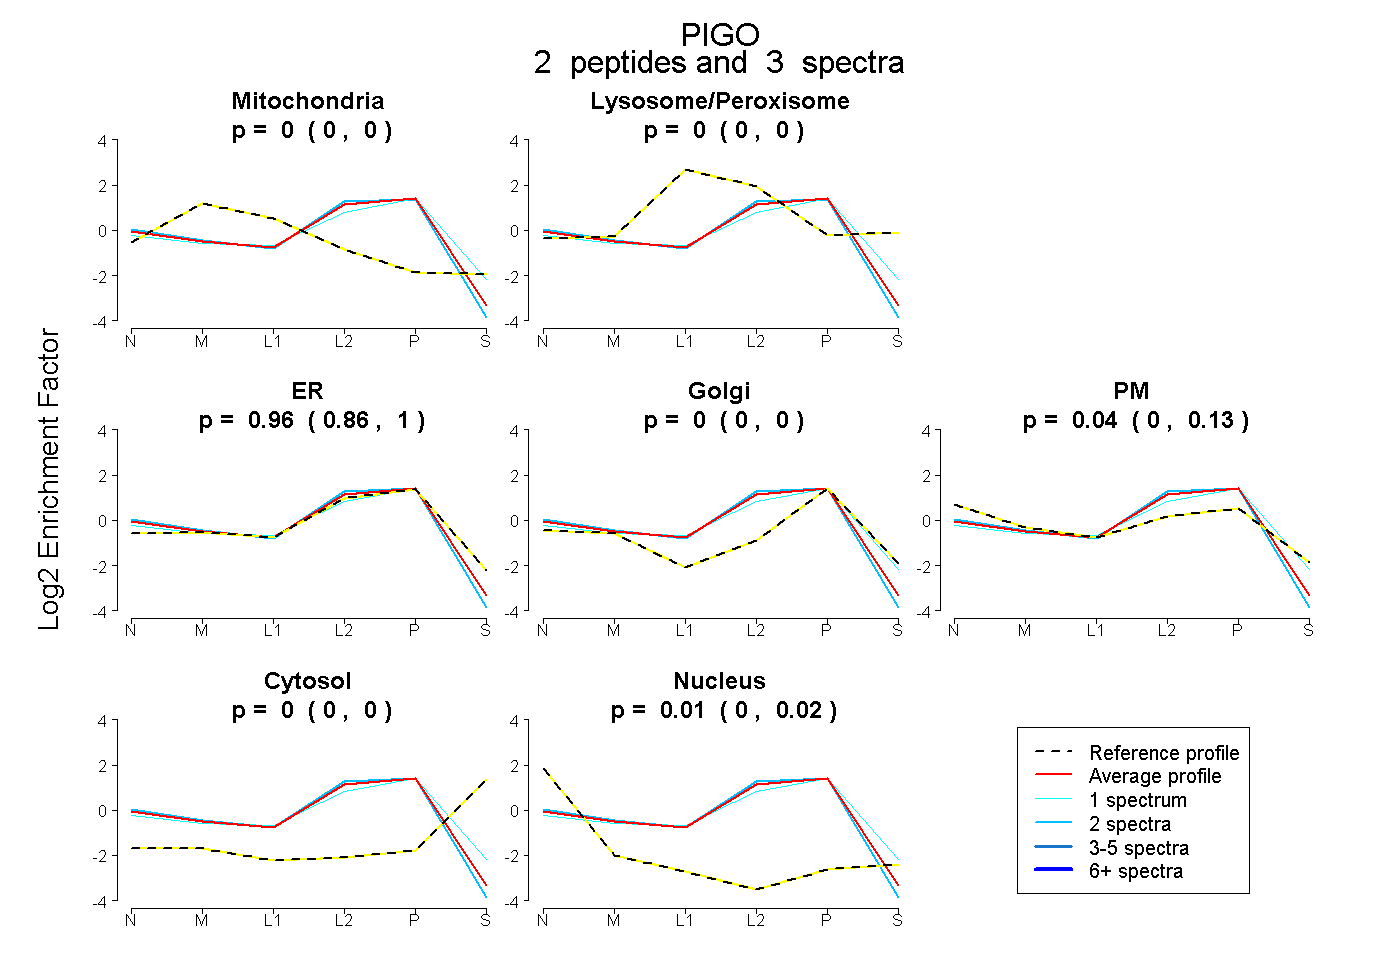
0.000 | 0.000
0.000 | 0.000
0.861 | 0.999
0.000 | 0.000
0.000 | 0.129
0.000 | 0.000
0.000 | 0.025
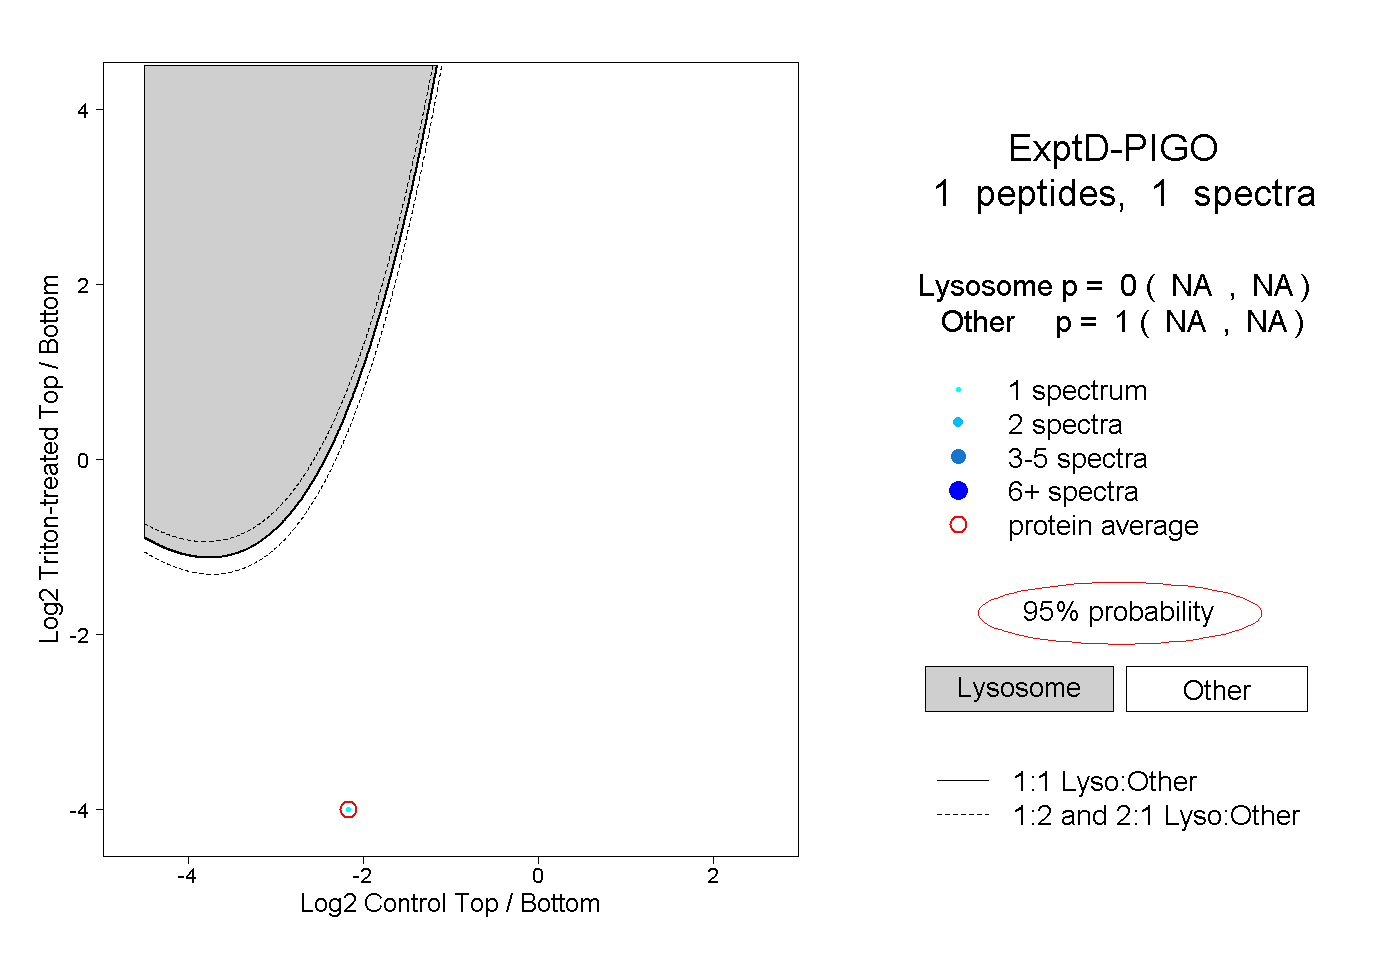
2peptides
spectra
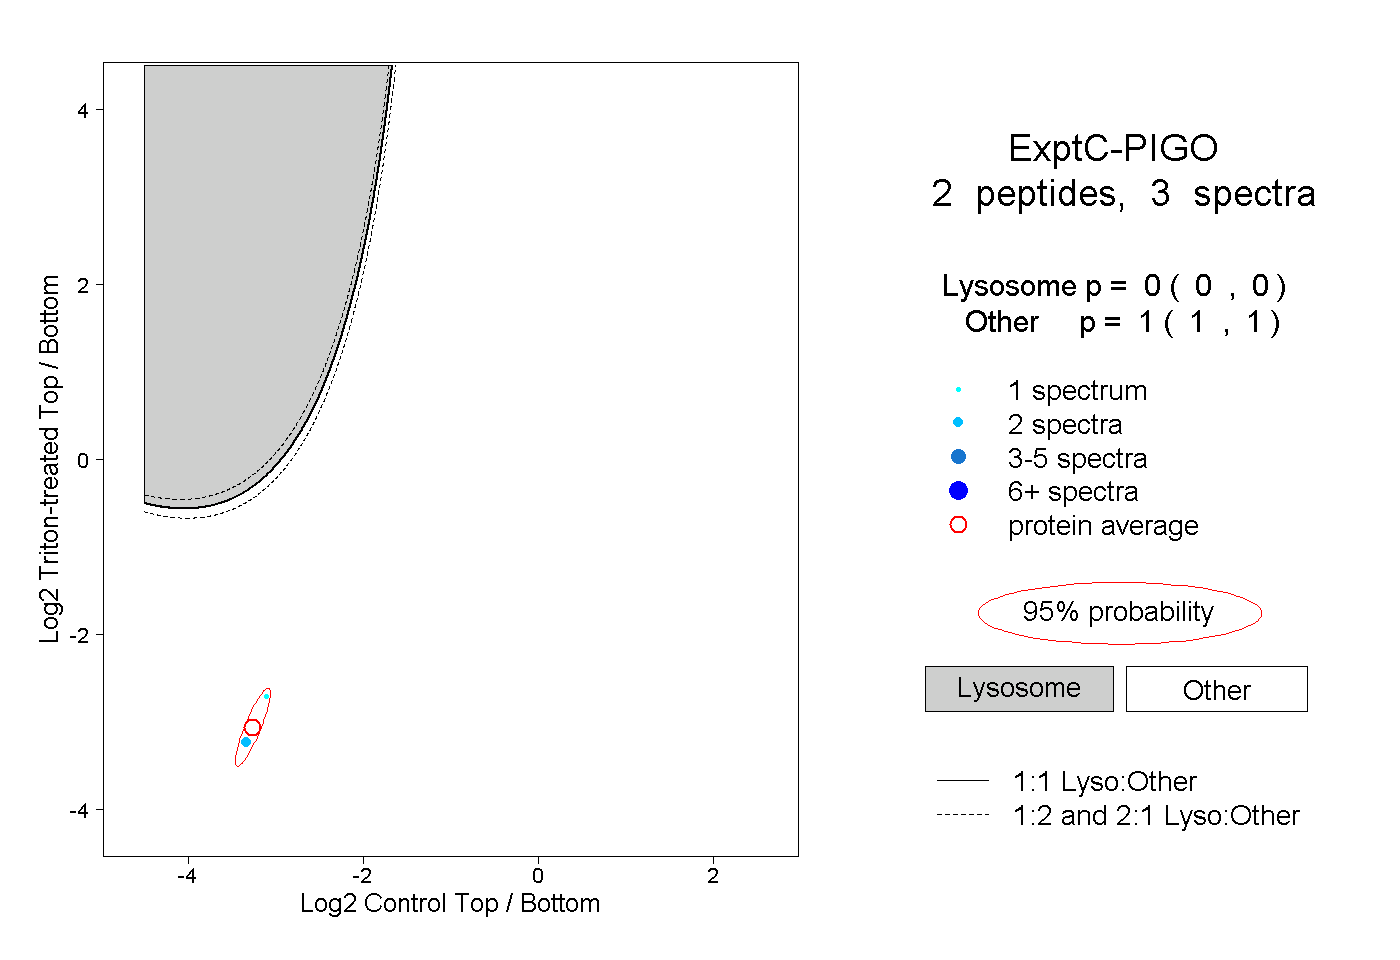
0.000 | 0.000
1.000 | 1.000