 4
4peptides
spectra
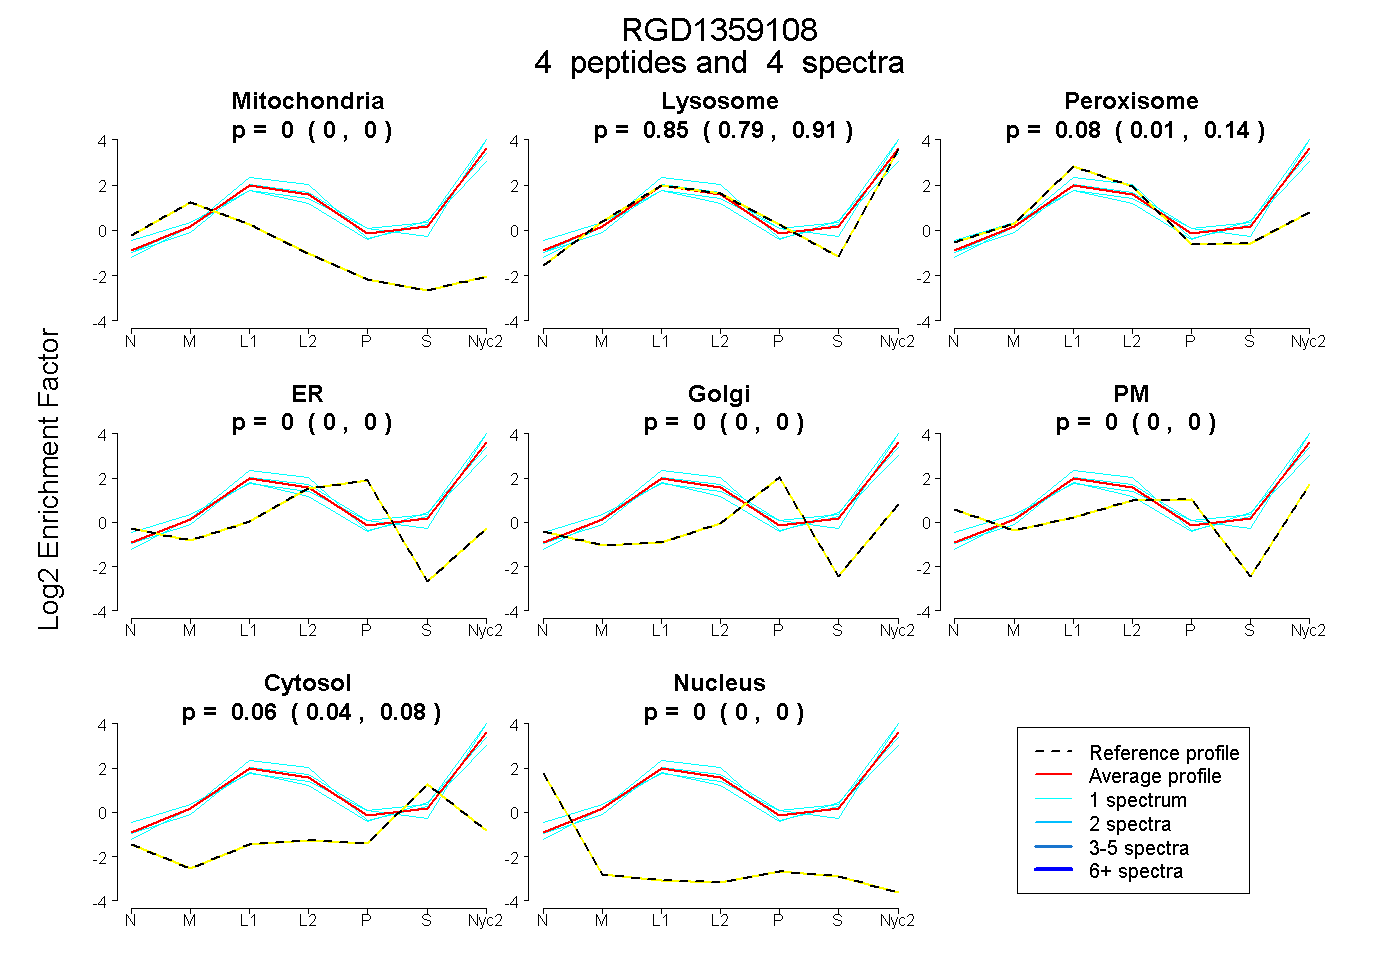
0.000 | 0.000
0.787 | 0.907
0.015 | 0.139
0.000 | 0.000
0.000 | 0.000
0.000 | 0.000
0.045 | 0.083
0.000 | 0.000
| Plot | Mito | Lyso | Perox | ER | Golgi | PM | Cytosol | Nucleus | |||||
| Expt A |
4 peptides |
4 spectra |
|
0.000 0.000 | 0.000 |
0.853 0.787 | 0.907 |
0.083 0.015 | 0.139 |
0.000 0.000 | 0.000 |
0.000 0.000 | 0.000 |
0.000 0.000 | 0.000 |
0.064 0.045 | 0.083 |
0.000 0.000 | 0.000 |
| 1 spectrum, DATGSFVLPFR | 0.000 | 0.946 | 0.000 | 0.000 | 0.000 | 0.000 | 0.054 | 0.000 | ||
| 1 spectrum, IVLEGTER | 0.000 | 0.829 | 0.032 | 0.000 | 0.000 | 0.000 | 0.139 | 0.000 | ||
| 1 spectrum, TLCLFLTPAER | 0.000 | 0.642 | 0.338 | 0.000 | 0.000 | 0.000 | 0.020 | 0.000 | ||
| 1 spectrum, HIWAPK | 0.000 | 0.946 | 0.000 | 0.000 | 0.000 | 0.024 | 0.031 | 0.000 |
| Plot | Lyso | Other | |||||||||||
| Expt C |
11 peptides |
26 spectra |
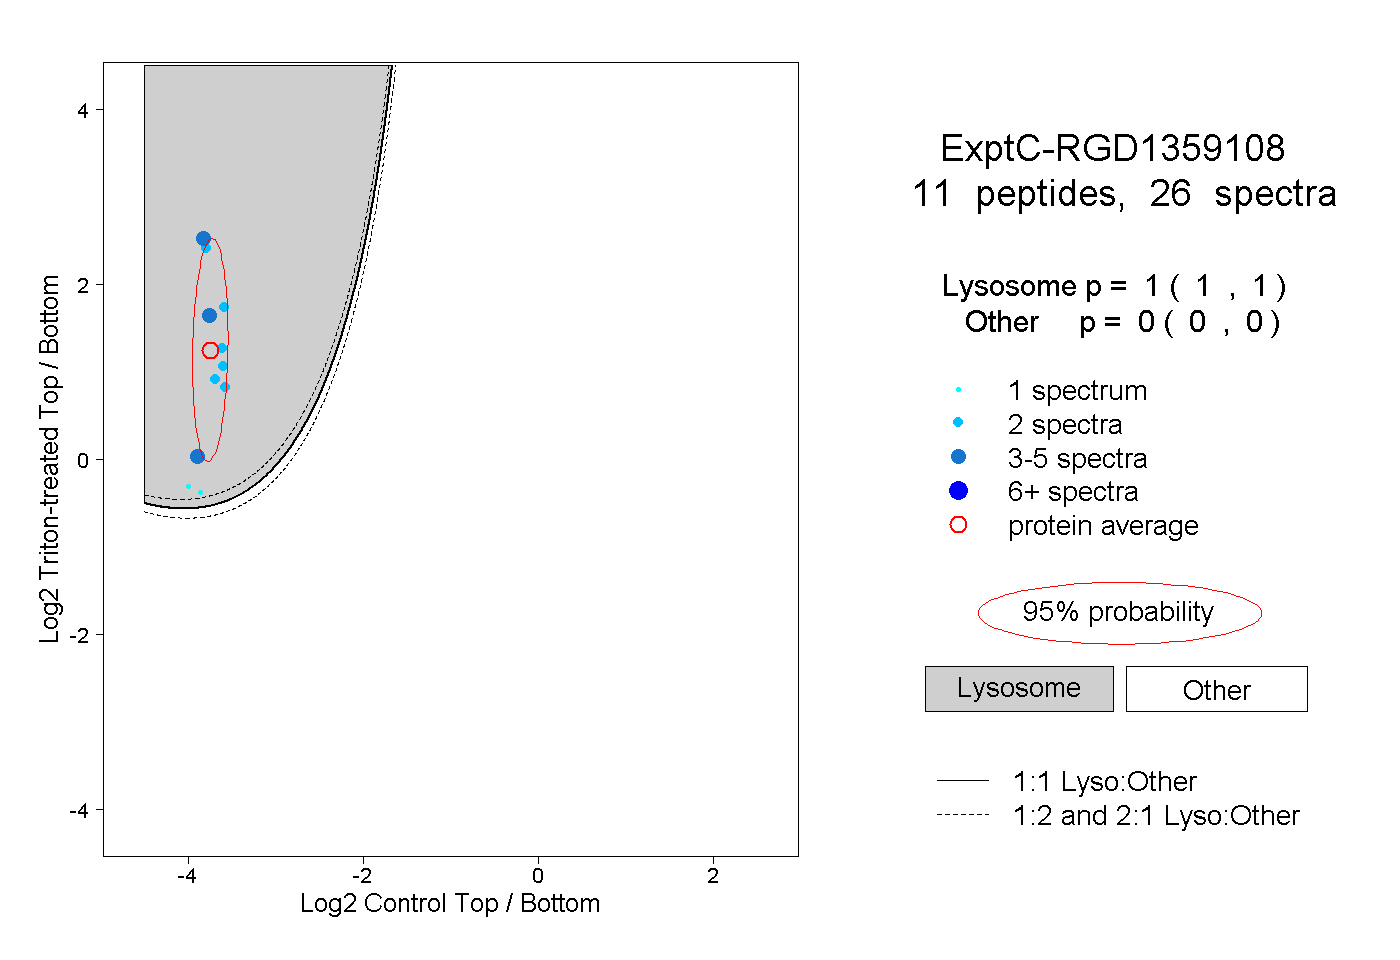 |
1.000 1.000 | 1.000 |
0.000 0.000 | 0.000 |