 4
4peptides
spectra
0.000 | 0.000
0.000 | 0.000
0.000 | 0.000
0.000 | 0.080
0.256 | 0.408
0.000 | 0.041
0.574 | 0.660
0.000 | 0.020
1peptide
spectrum
NA | NA
NA | NA
NA | NA
NA | NA
NA | NA
NA | NA
NA | NA
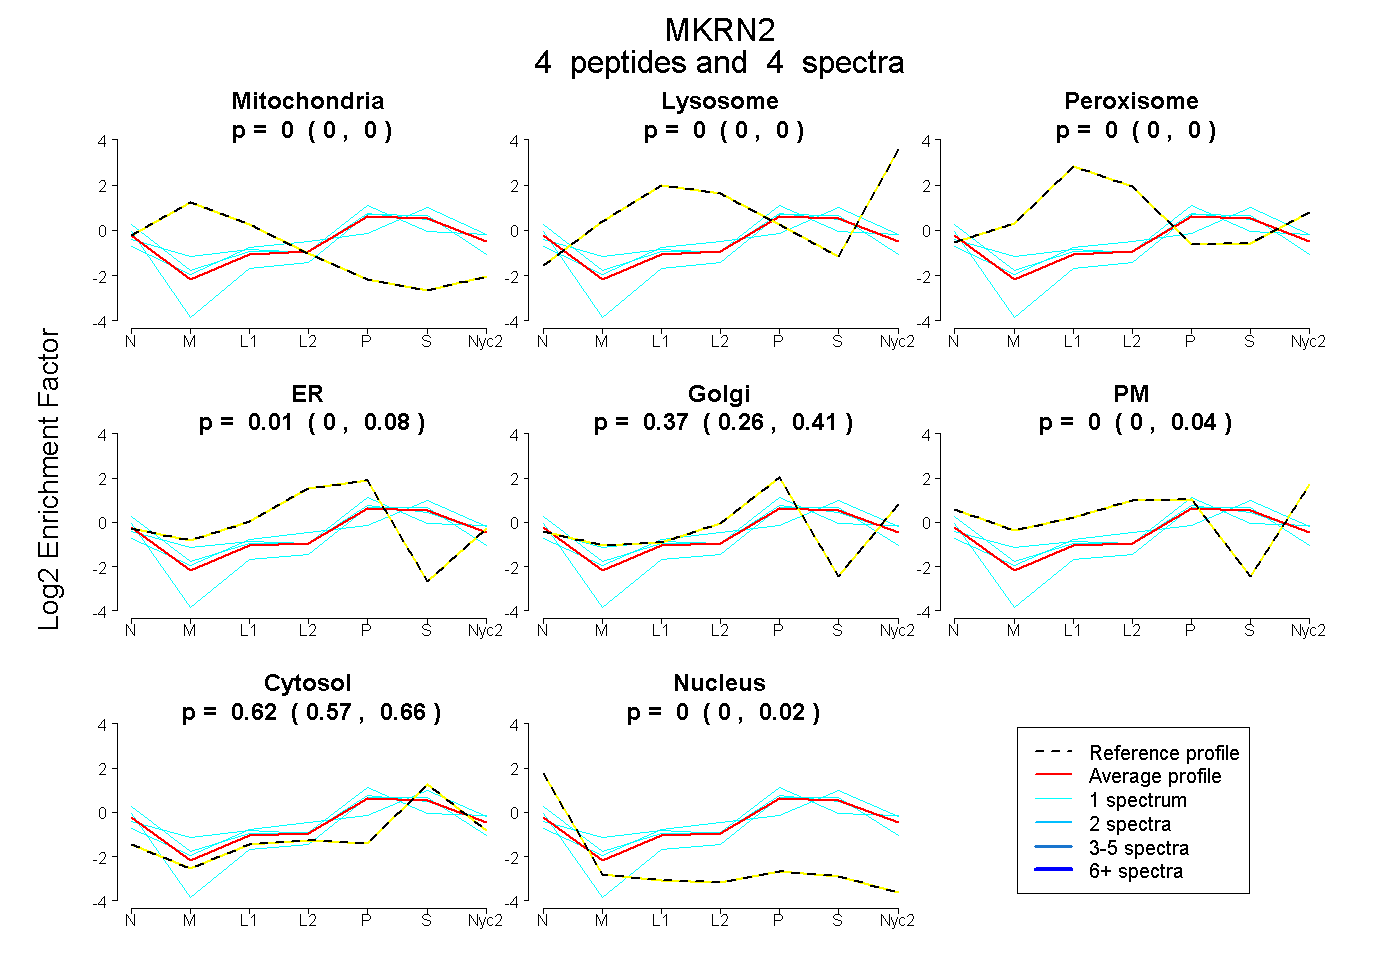
| Plot | Mito | Lyso | Perox | ER | Golgi | PM | Cytosol | Nucleus | |||||
| Expt A |
4 peptides |
4 spectra |
|
0.000 0.000 | 0.000 |
0.000 0.000 | 0.000 |
0.000 0.000 | 0.000 |
0.007 0.000 | 0.080 |
0.372 0.256 | 0.408 |
0.000 0.000 | 0.041 |
0.621 0.574 | 0.660 |
0.000 0.000 | 0.020 |
||
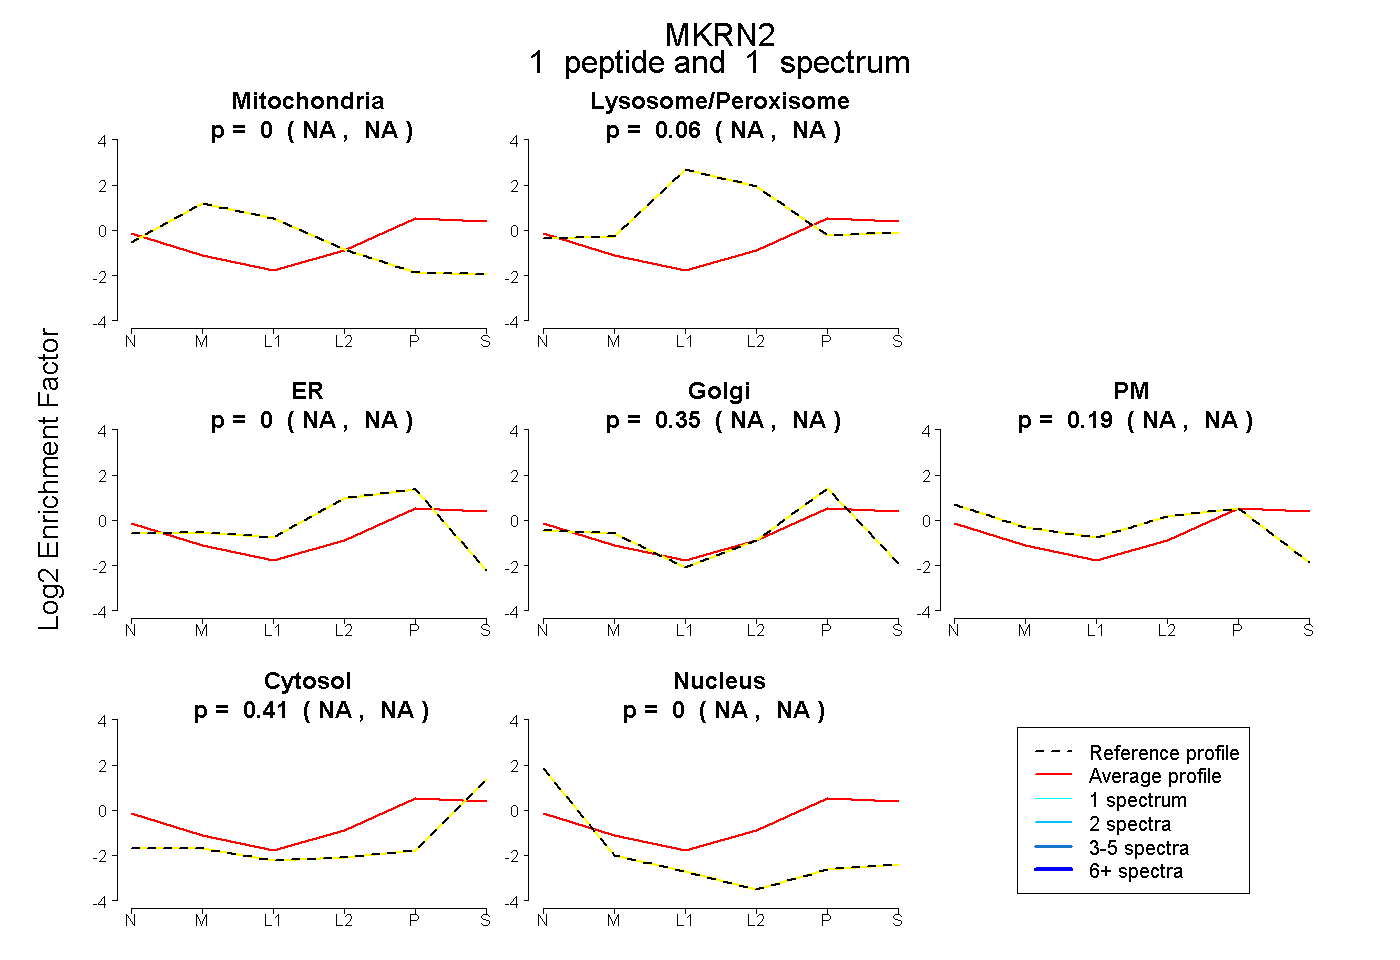
| Plot | Mito | Lyso or Perox | ER | Golgi | PM | Cytosol | Nucleus | ||||||
| Expt B |
1 peptide |
1 spectrum |
|
0.000 NA | NA |
0.057 NA | NA |
0.000 NA | NA |
0.345 NA | NA |
0.189 NA | NA |
0.409 NA | NA |
0.000 NA | NA |