 8
8peptides
spectra
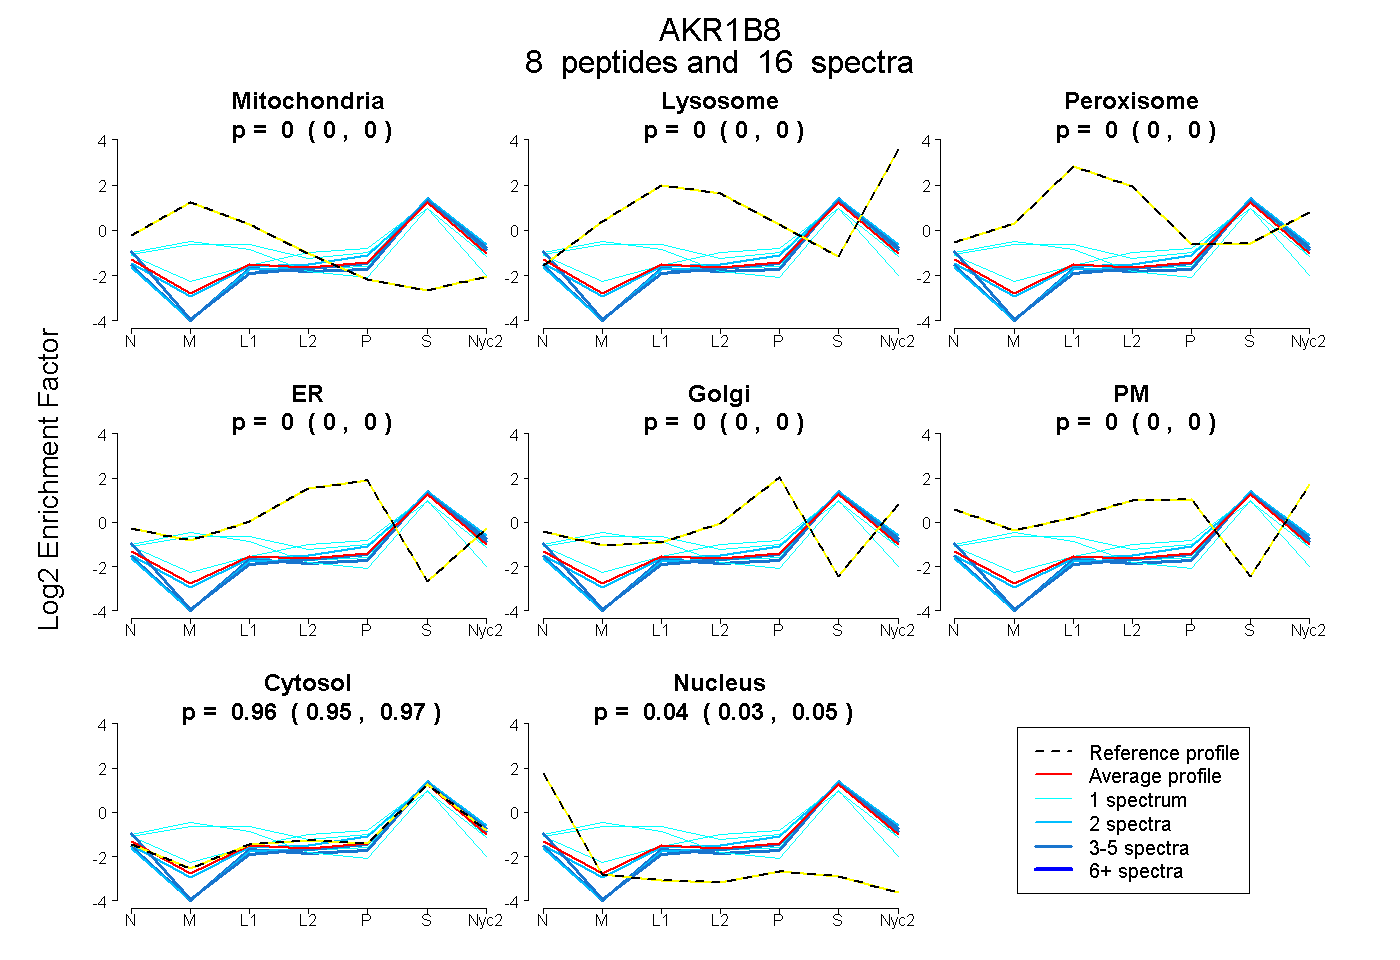
0.000 | 0.000
0.000 | 0.000
0.000 | 0.000
0.000 | 0.000
0.000 | 0.000
0.000 | 0.000
0.951 | 0.966
0.033 | 0.048
| Plot | Mito | Lyso | Perox | ER | Golgi | PM | Cytosol | Nucleus | |||||
| Expt A |
8 peptides |
16 spectra |
|
0.000 0.000 | 0.000 |
0.000 0.000 | 0.000 |
0.000 0.000 | 0.000 |
0.000 0.000 | 0.000 |
0.000 0.000 | 0.000 |
0.000 0.000 | 0.000 |
0.959 0.951 | 0.966 |
0.041 0.033 | 0.048 |
| 2 spectra, MPIVGLGTWK | 0.000 | 0.000 | 0.000 | 0.000 | 0.000 | 0.000 | 1.000 | 0.000 | ||
| 1 spectrum, DEQGNVLPSK | 0.000 | 0.000 | 0.000 | 0.052 | 0.045 | 0.000 | 0.903 | 0.000 | ||
| 1 spectrum, LIQYCHSK | 0.339 | 0.000 | 0.000 | 0.000 | 0.000 | 0.000 | 0.661 | 0.000 | ||
| 2 spectra, AAIDAGYR | 0.000 | 0.000 | 0.000 | 0.000 | 0.000 | 0.000 | 0.996 | 0.004 | ||
| 4 spectra, STPNQVK | 0.000 | 0.000 | 0.000 | 0.000 | 0.000 | 0.000 | 0.930 | 0.070 | ||
| 1 spectrum, ALGVSNFNHFQIER | 0.217 | 0.000 | 0.102 | 0.000 | 0.000 | 0.000 | 0.682 | 0.000 | ||
| 1 spectrum, LWPTCFEK | 0.000 | 0.000 | 0.000 | 0.000 | 0.000 | 0.000 | 0.958 | 0.042 | ||
| 4 spectra, GIVVTAYSPLGSPDRPR | 0.000 | 0.000 | 0.000 | 0.000 | 0.000 | 0.000 | 0.970 | 0.030 |
| Plot | Mito | Lyso or Perox | ER | Golgi | PM | Cytosol | Nucleus | ||||||
| Expt B |
1 peptide |
1 spectrum |
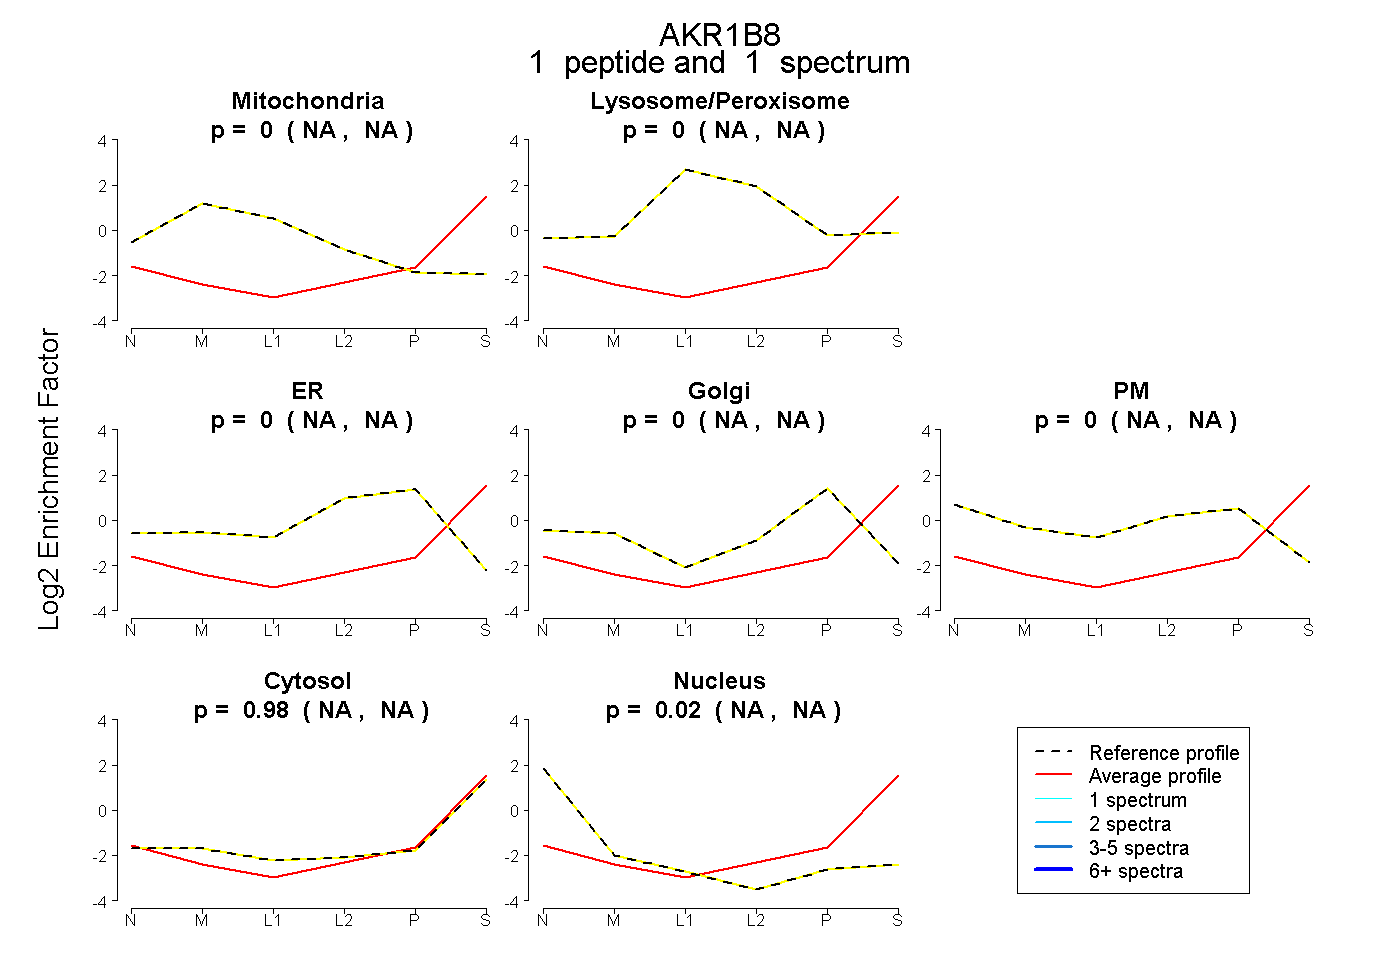 |
0.000 NA | NA |
0.000 NA | NA |
0.000 NA | NA |
0.000 NA | NA |
0.000 NA | NA |
0.977 NA | NA |
0.023 NA | NA |
|||
| Plot | Lyso | Other | |||||||||||
| Expt C |
4 peptides |
12 spectra |
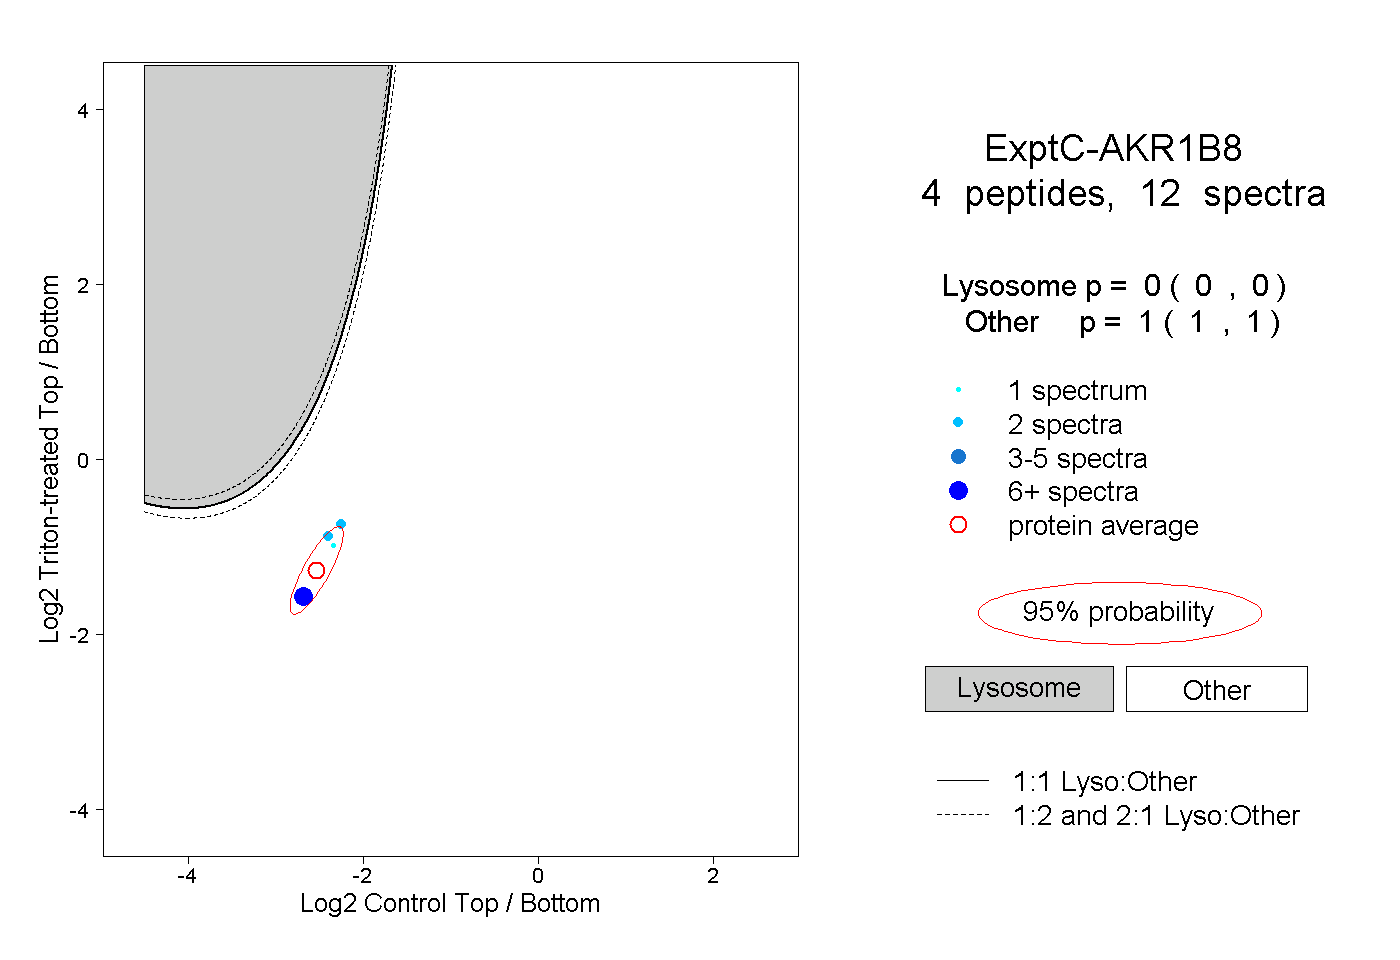 |
0.000 0.000 | 0.000 |
1.000 1.000 | 1.000 |