 9
9peptides
spectra
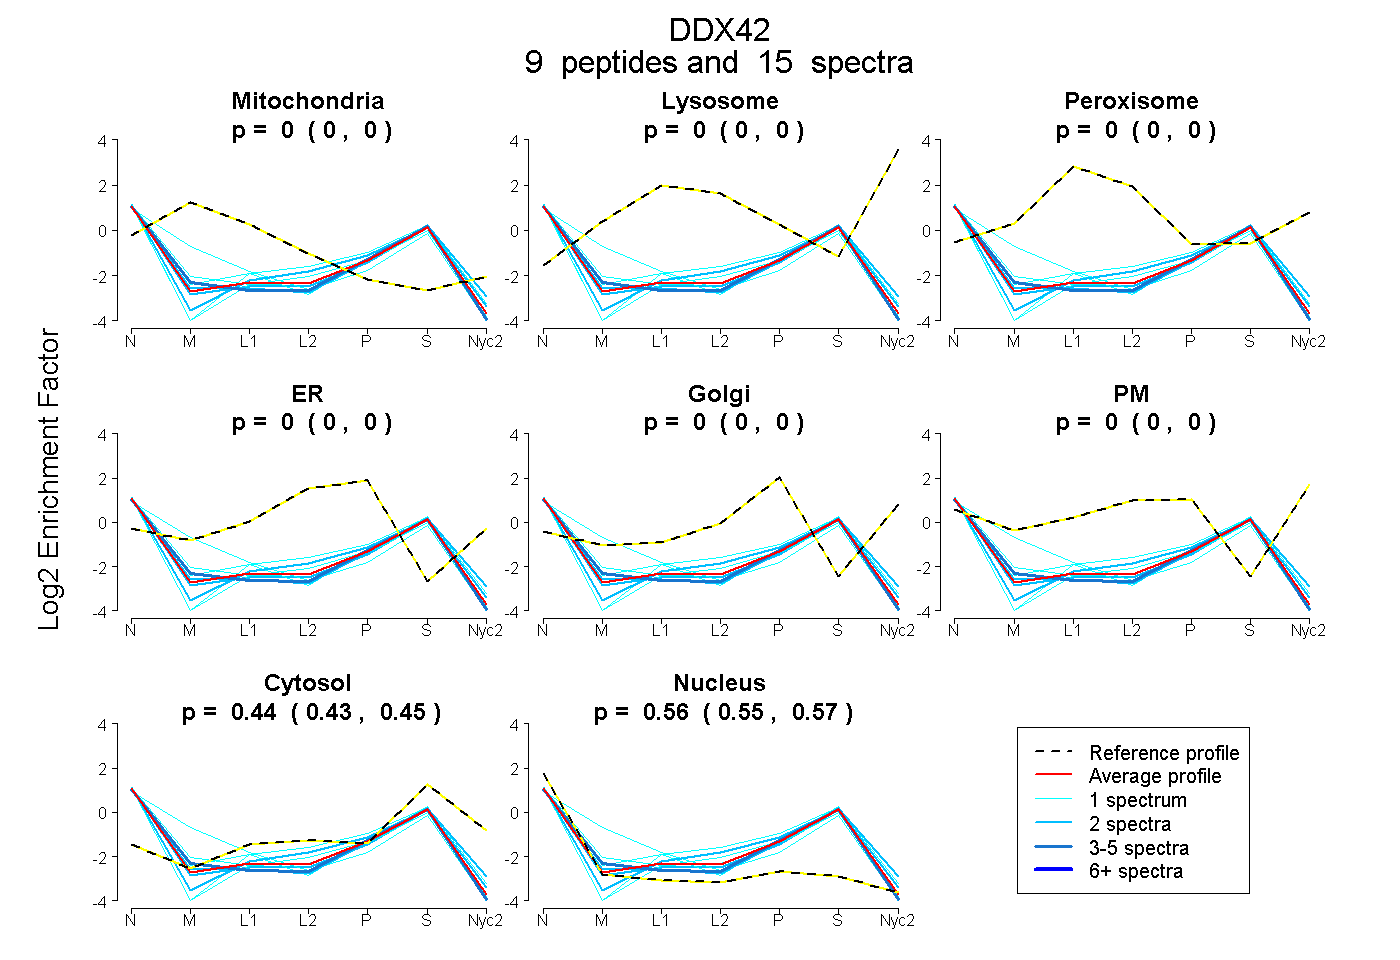
0.000 | 0.000
0.000 | 0.000
0.000 | 0.000
0.000 | 0.000
0.000 | 0.000
0.000 | 0.000
0.433 | 0.446
0.553 | 0.566
3peptides
spectra
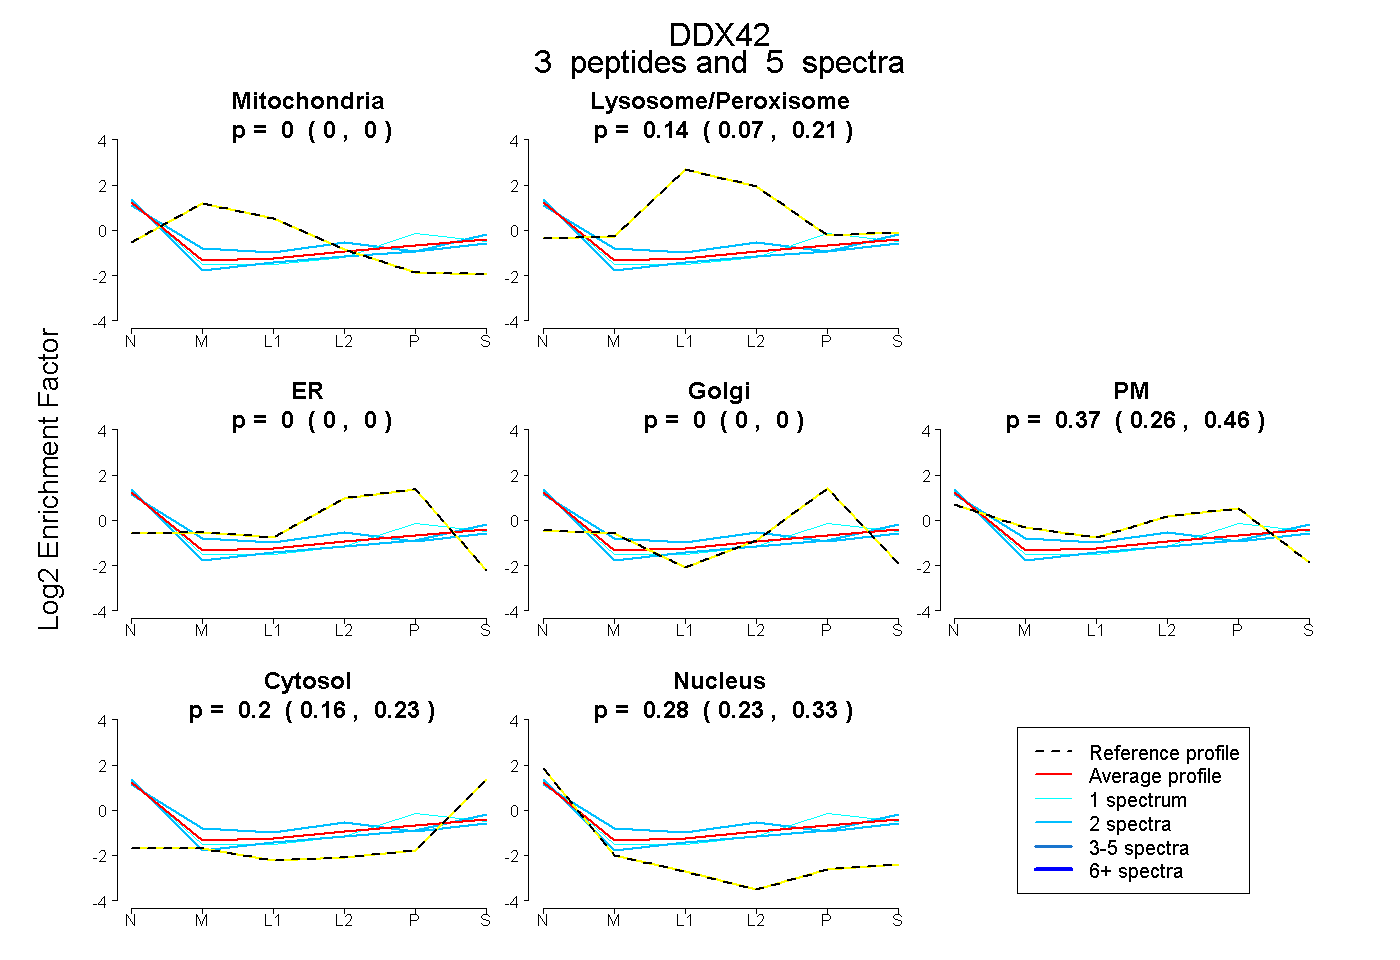
0.000 | 0.000
0.067 | 0.207
0.000 | 0.000
0.000 | 0.000
0.265 | 0.458
0.161 | 0.234
0.225 | 0.334
2peptides
spectra
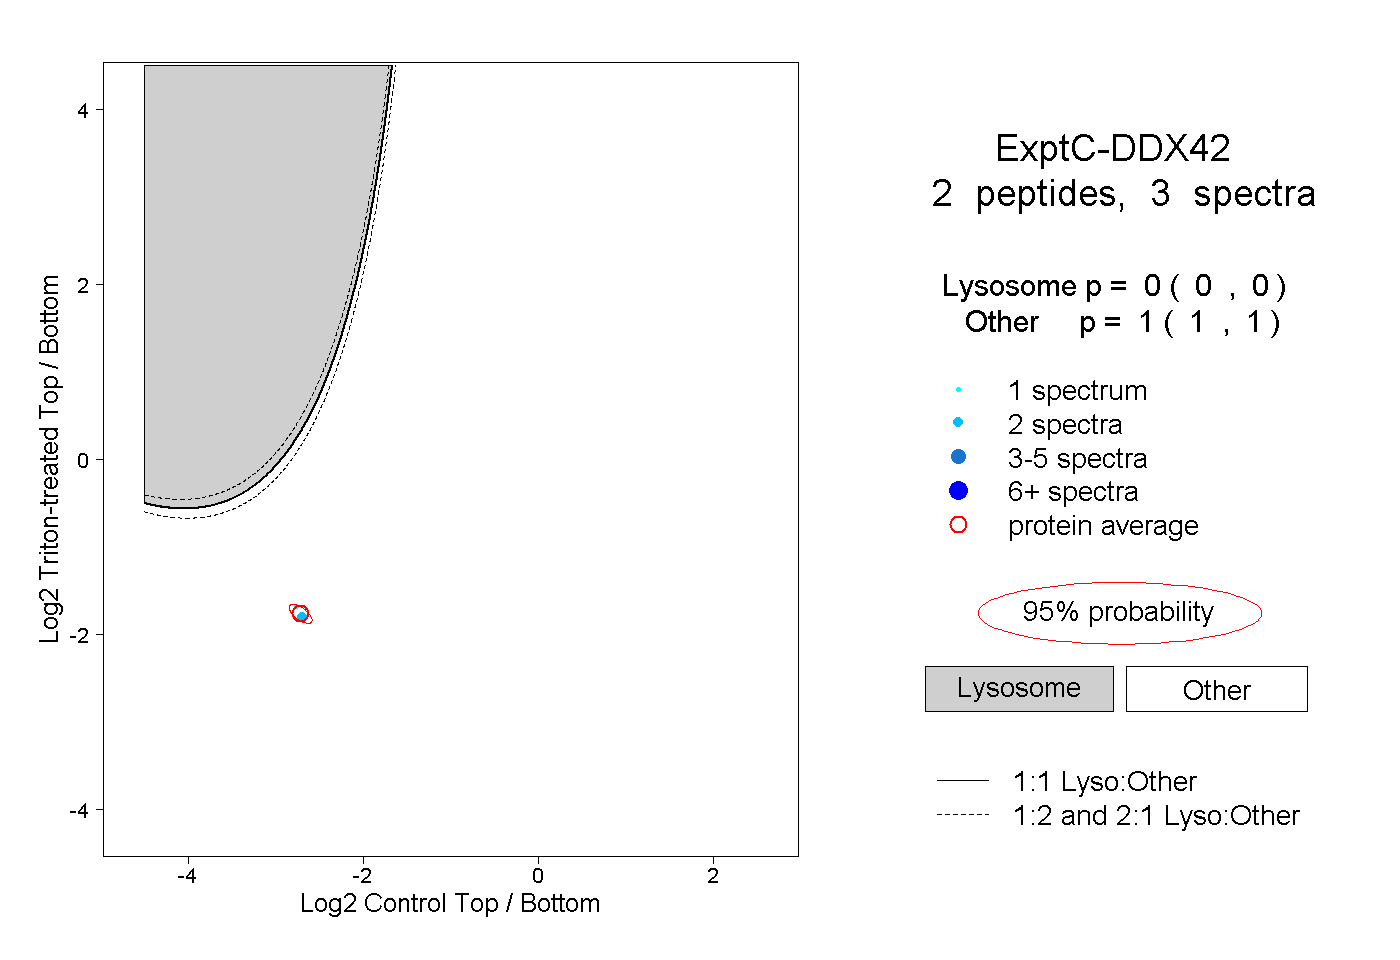
0.000 | 0.000
1.000 | 1.000