 1
1peptide
spectra
0.000 | 0.000
0.000 | 0.115
0.000 | 0.061
0.000 | 0.027
0.000 | 0.388
0.162 | 0.535
0.282 | 0.502
0.000 | 0.003
1peptide
spectra
0.000 | 0.000
1.000 | 1.000
| Plot | Mito | Lyso | Perox | ER | Golgi | PM | Cytosol | Nucleus | |||||
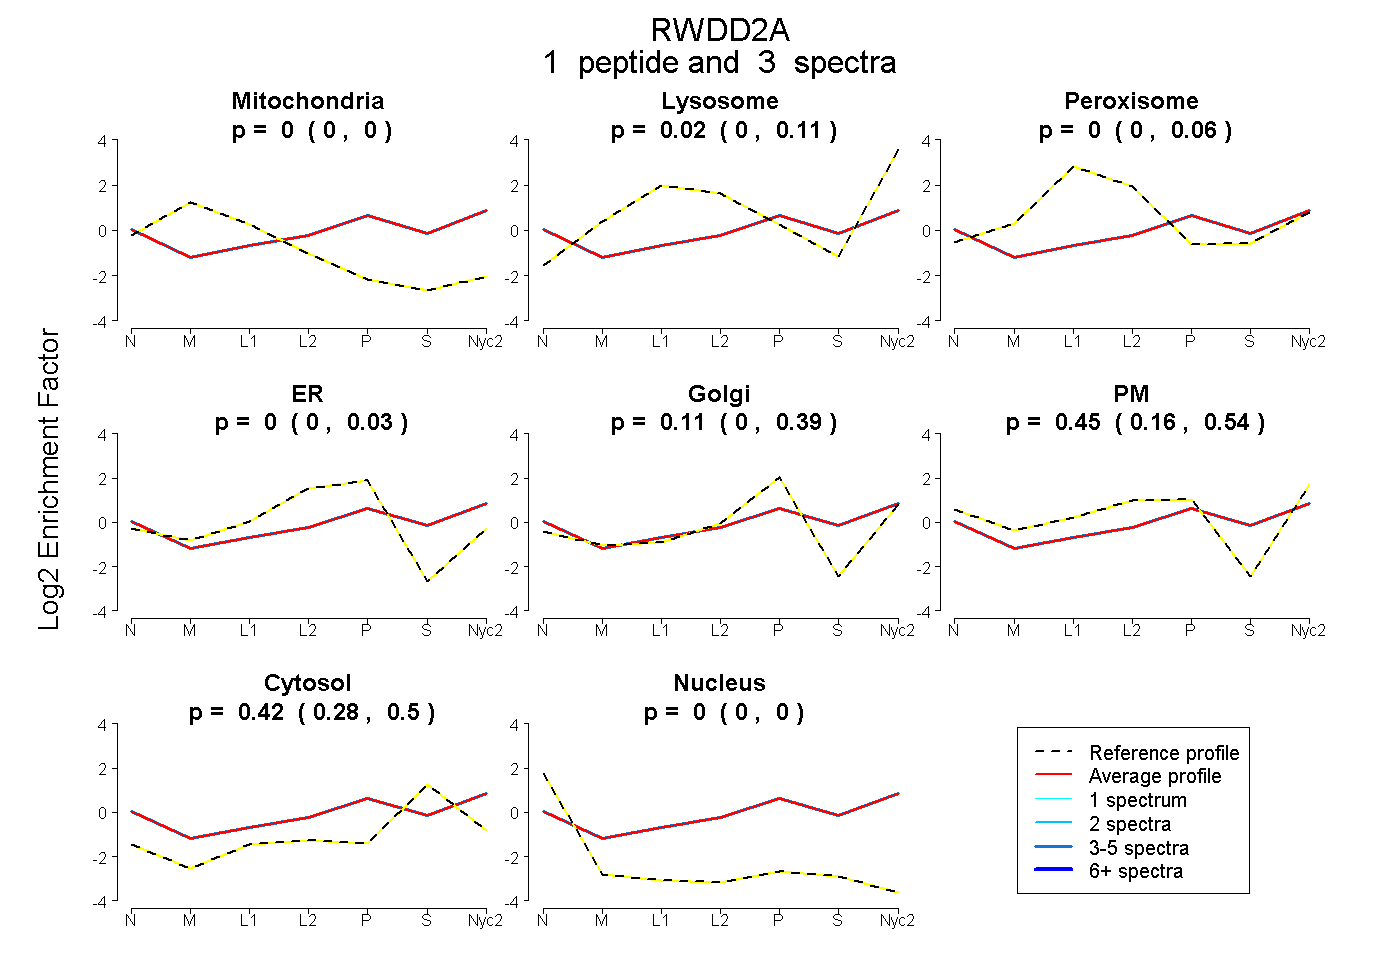
| Expt A |
1 peptide |
3 spectra |
|
0.000 0.000 | 0.000 |
0.015 0.000 | 0.115 |
0.000 0.000 | 0.061 |
0.000 0.000 | 0.027 |
0.115 0.000 | 0.388 |
0.451 0.162 | 0.535 |
0.419 0.282 | 0.502 |
0.000 0.000 | 0.003 |
||
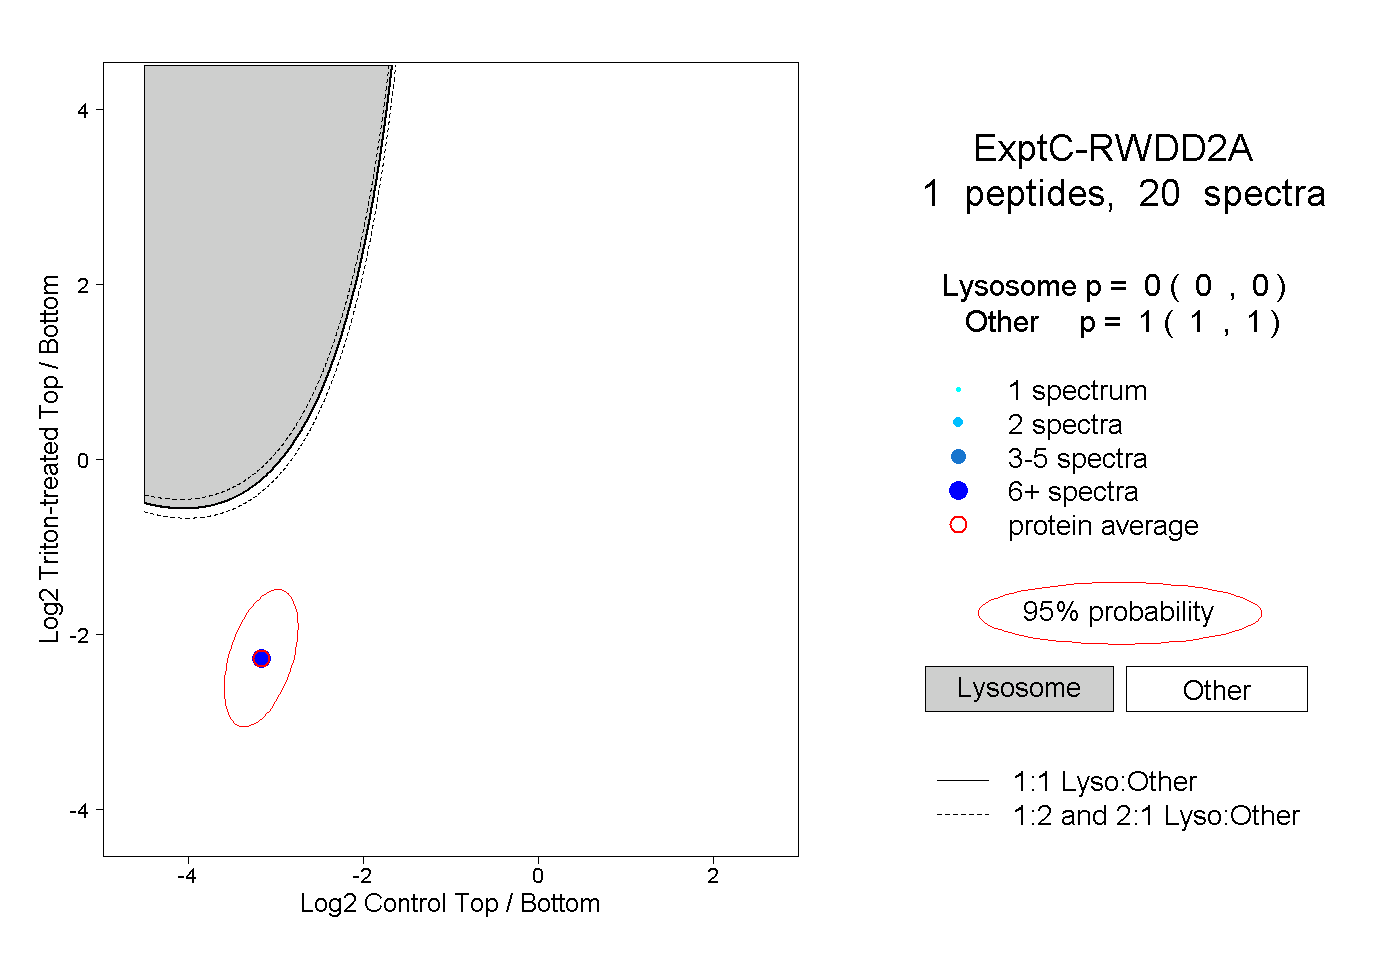
| Plot | Lyso | Other | |||||||||||
| Expt C |
1 peptide |
20 spectra |
|
0.000 0.000 | 0.000 |
1.000 1.000 | 1.000 |