 4
4peptides
spectra
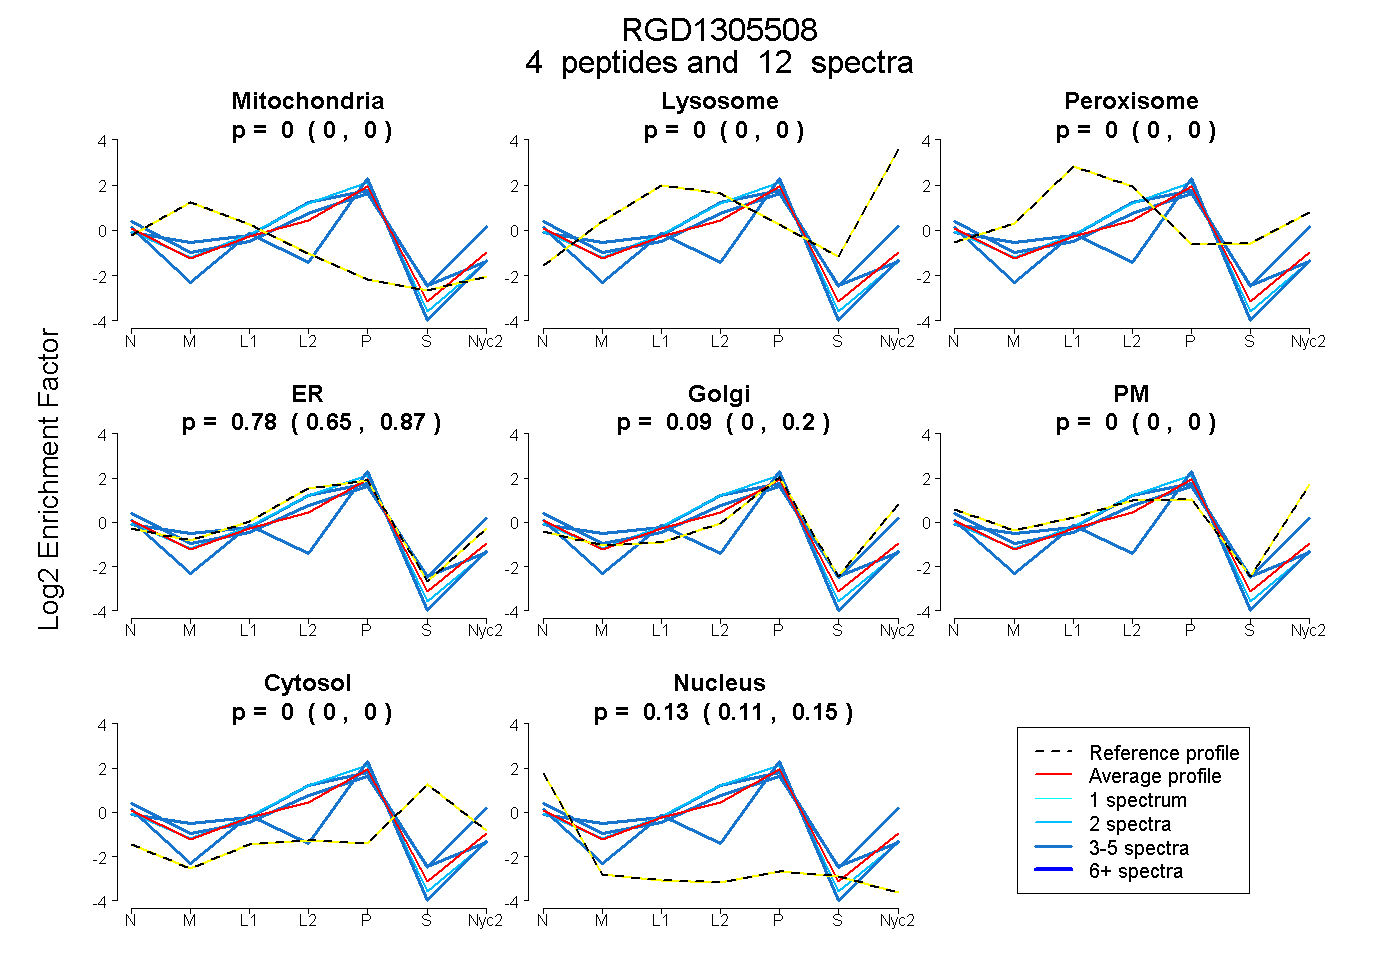
0.000 | 0.000
0.000 | 0.000
0.000 | 0.000
0.651 | 0.869
0.000 | 0.197
0.000 | 0.000
0.000 | 0.000
0.107 | 0.151
2peptides
spectra
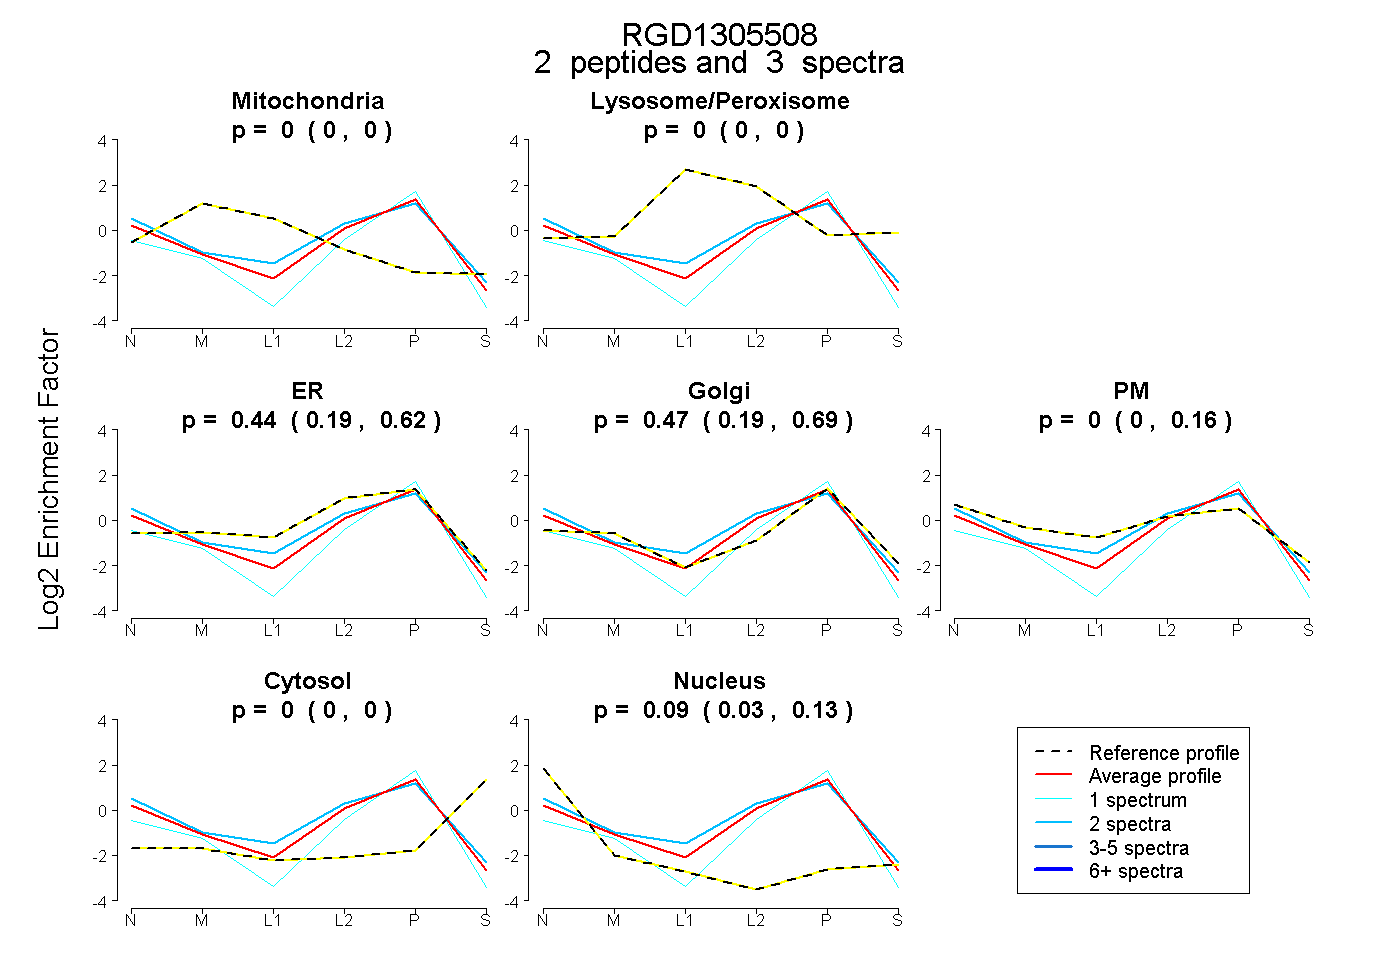
0.000 | 0.000
0.000 | 0.000
0.189 | 0.622
0.193 | 0.687
0.000 | 0.160
0.000 | 0.000
0.028 | 0.134
3peptides
spectra
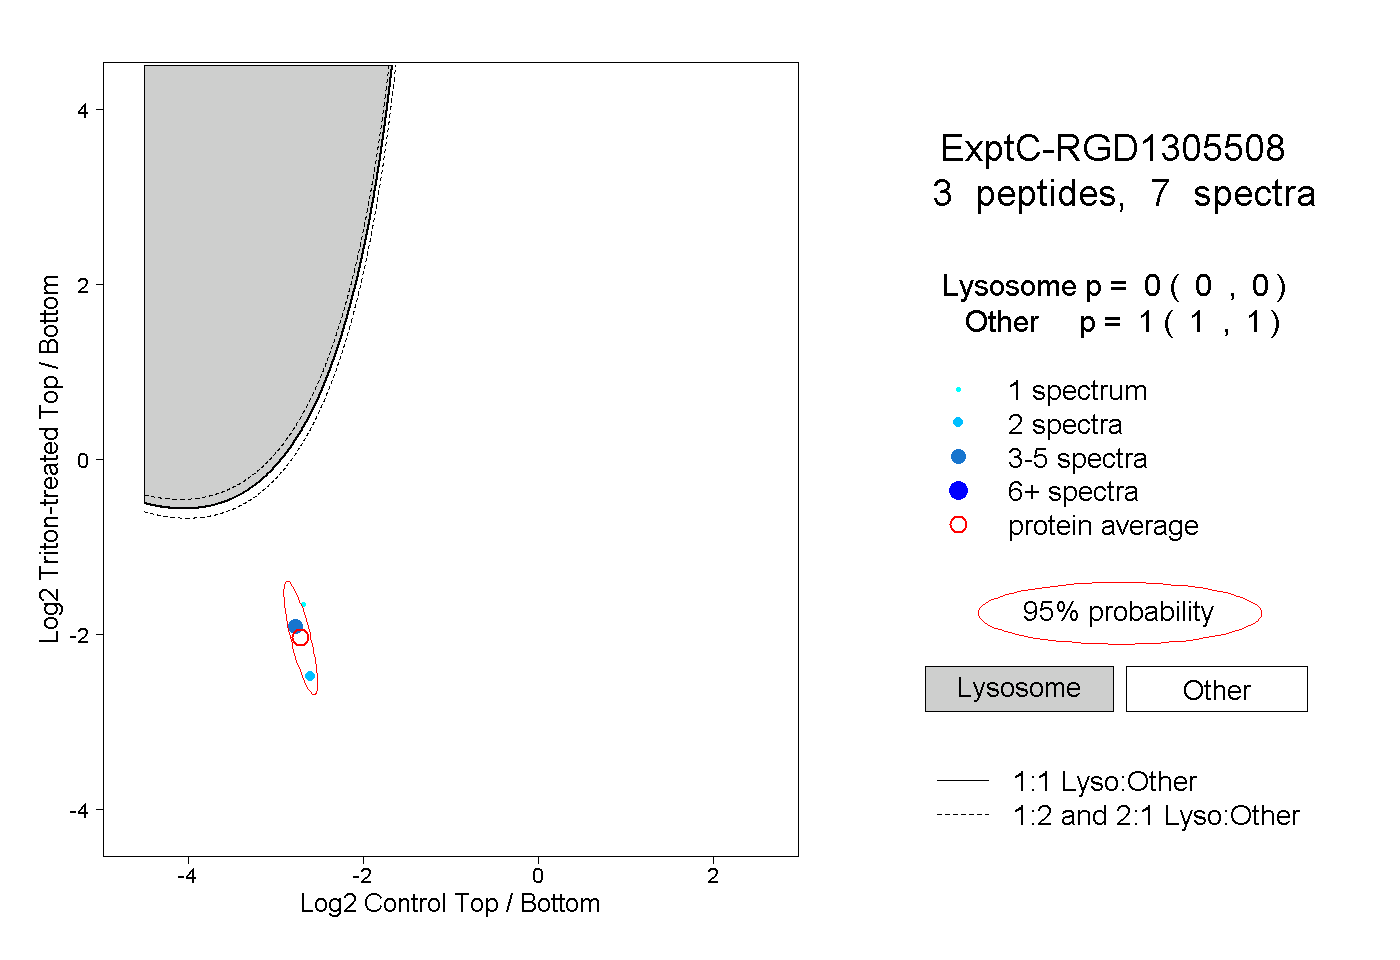
0.000 | 0.000
1.000 | 1.000