 9
9peptides
spectra
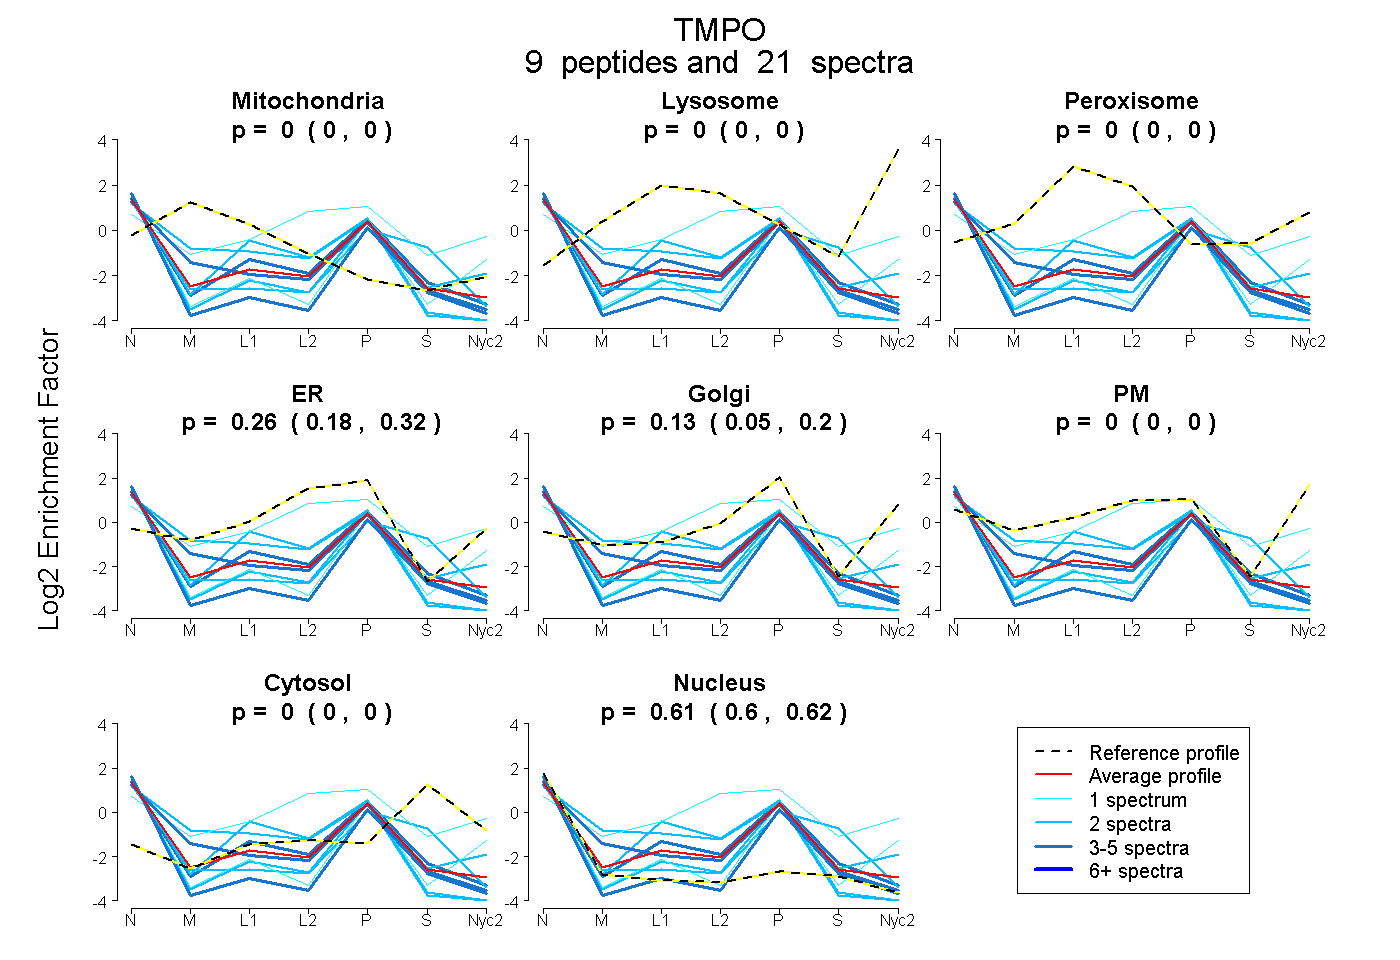
0.000 | 0.000
0.000 | 0.000
0.000 | 0.000
0.182 | 0.323
0.053 | 0.196
0.000 | 0.000
0.000 | 0.000
0.596 | 0.624
| Plot | Mito | Lyso | Perox | ER | Golgi | PM | Cytosol | Nucleus | |||||
| Expt A |
9 peptides |
21 spectra |
|
0.000 0.000 | 0.000 |
0.000 0.000 | 0.000 |
0.000 0.000 | 0.000 |
0.258 0.182 | 0.323 |
0.130 0.053 | 0.196 |
0.000 0.000 | 0.000 |
0.000 0.000 | 0.000 |
0.611 0.596 | 0.624 |
| 1 spectrum, VDGAVISESTPIAETIK | 0.000 | 0.000 | 0.000 | 0.000 | 0.403 | 0.000 | 0.000 | 0.597 | ||
| 2 spectra, GGPLQALTR | 0.000 | 0.000 | 0.000 | 0.000 | 0.141 | 0.000 | 0.254 | 0.605 | ||
| 2 spectra, GAAGRPLELSDFR | 0.000 | 0.000 | 0.000 | 0.431 | 0.000 | 0.000 | 0.000 | 0.569 | ||
| 2 spectra, MEESFSSK | 0.137 | 0.000 | 0.000 | 0.330 | 0.177 | 0.000 | 0.000 | 0.356 | ||
| 4 spectra, YVPLADVK | 0.000 | 0.000 | 0.000 | 0.362 | 0.000 | 0.000 | 0.000 | 0.638 | ||
| 2 spectra, ASSNDSLVANR | 0.000 | 0.000 | 0.000 | 0.228 | 0.000 | 0.000 | 0.000 | 0.772 | ||
| 1 spectrum, SSTPLPTVSSSAENTR | 0.000 | 0.000 | 0.018 | 0.456 | 0.000 | 0.270 | 0.203 | 0.052 | ||
| 4 spectra, YGVNPGPIVGTTR | 0.000 | 0.000 | 0.000 | 0.000 | 0.164 | 0.000 | 0.000 | 0.836 | ||
| 3 spectra, AEVGEK | 0.000 | 0.000 | 0.000 | 0.382 | 0.000 | 0.000 | 0.000 | 0.618 |
| Plot | Mito | Lyso or Perox | ER | Golgi | PM | Cytosol | Nucleus | ||||||
| Expt B |
5 peptides |
8 spectra |
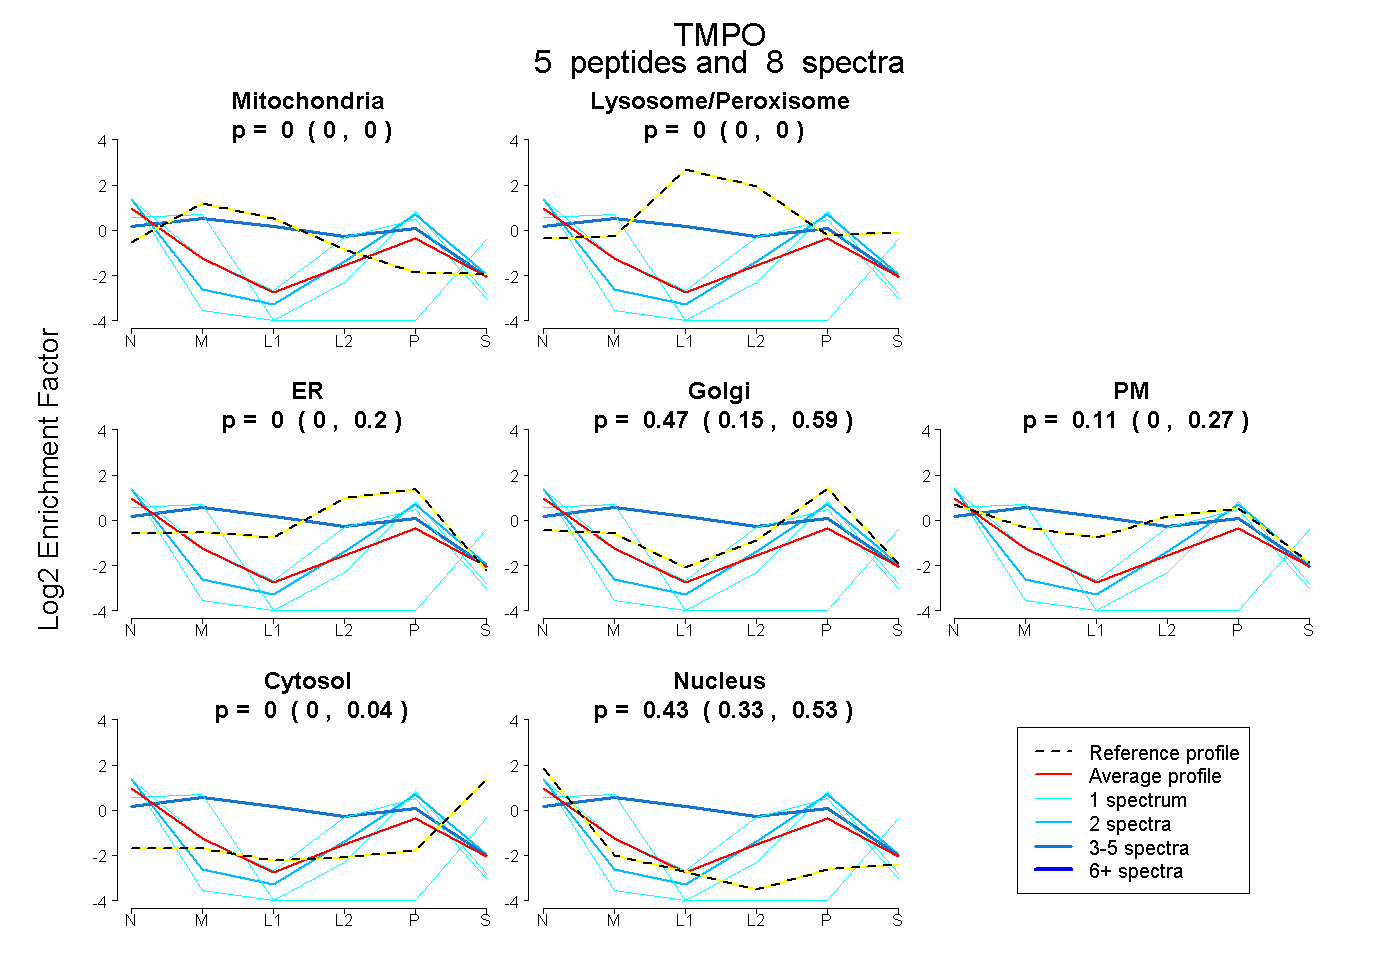 |
0.000 0.000 | 0.000 |
0.000 0.000 | 0.000 |
0.000 0.000 | 0.200 |
0.467 0.148 | 0.592 |
0.105 0.000 | 0.273 |
0.000 0.000 | 0.038 |
0.428 0.335 | 0.526 |
|||
| Plot | Lyso | Other | |||||||||||
| Expt C |
2 peptides |
2 spectra |
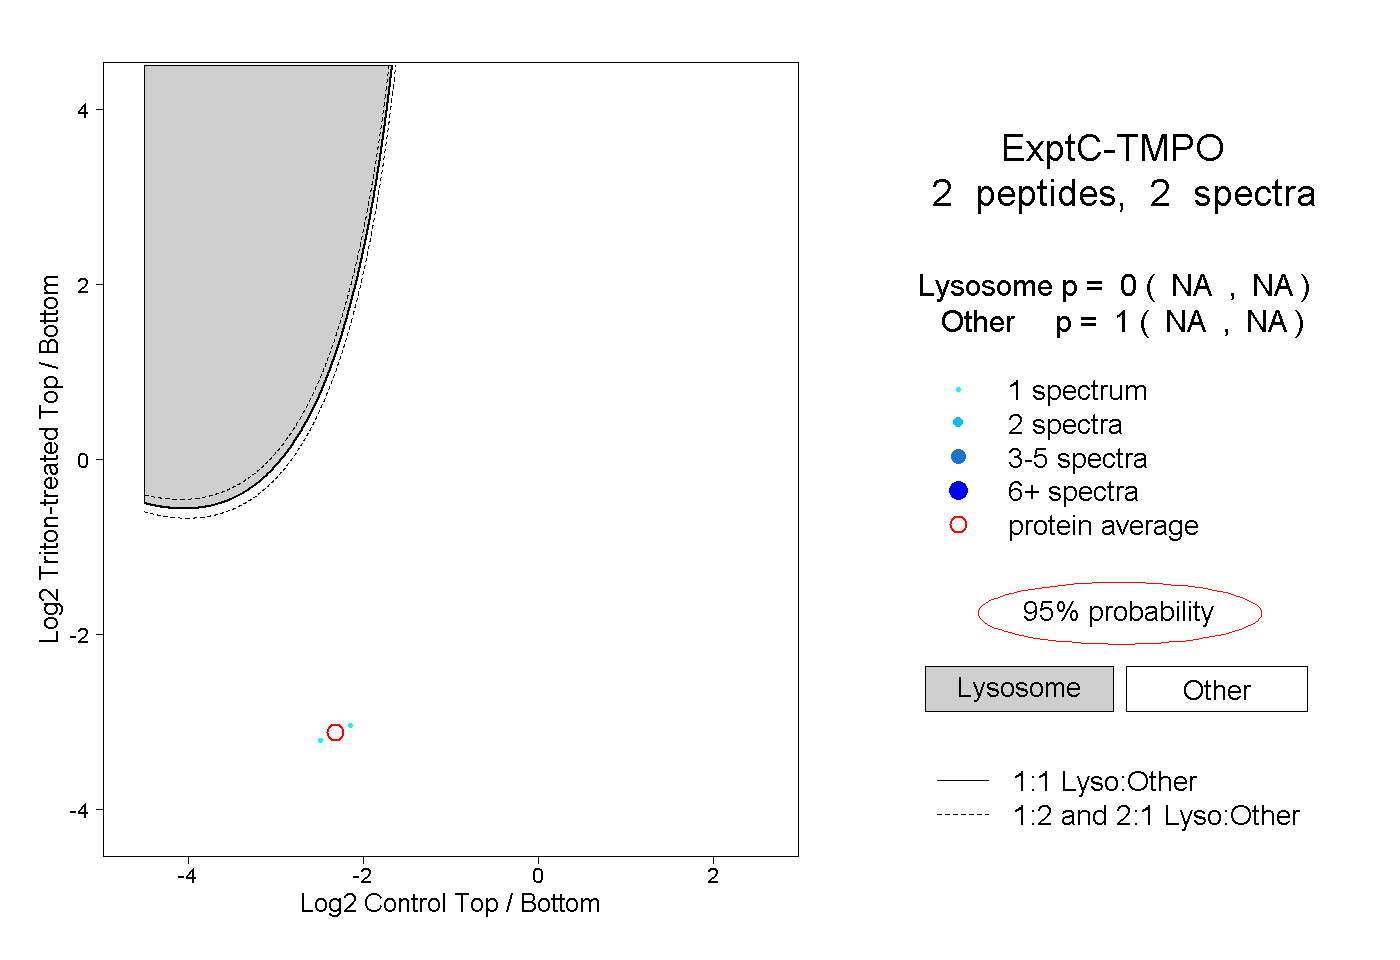 |
0.000 NA | NA |
1.000 NA | NA |
||||||||
| Plot | Lyso | Other | |||||||||||
| Expt D |
2 peptides |
3 spectra |
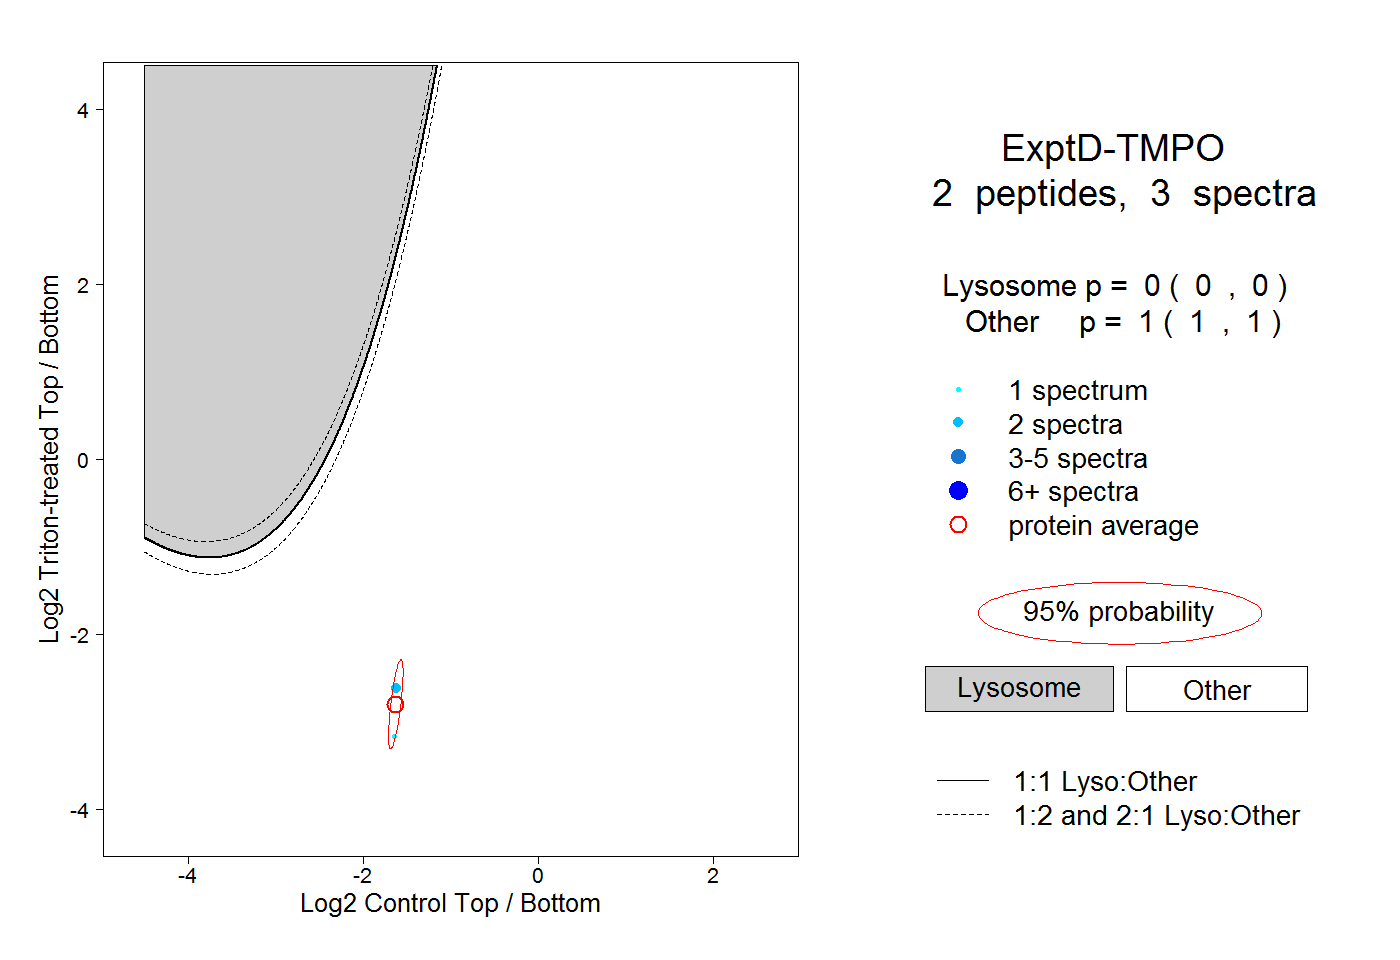 |
0.000 0.000 | 0.000 |
1.000 1.000 | 1.000 |