 17
17peptides
spectra
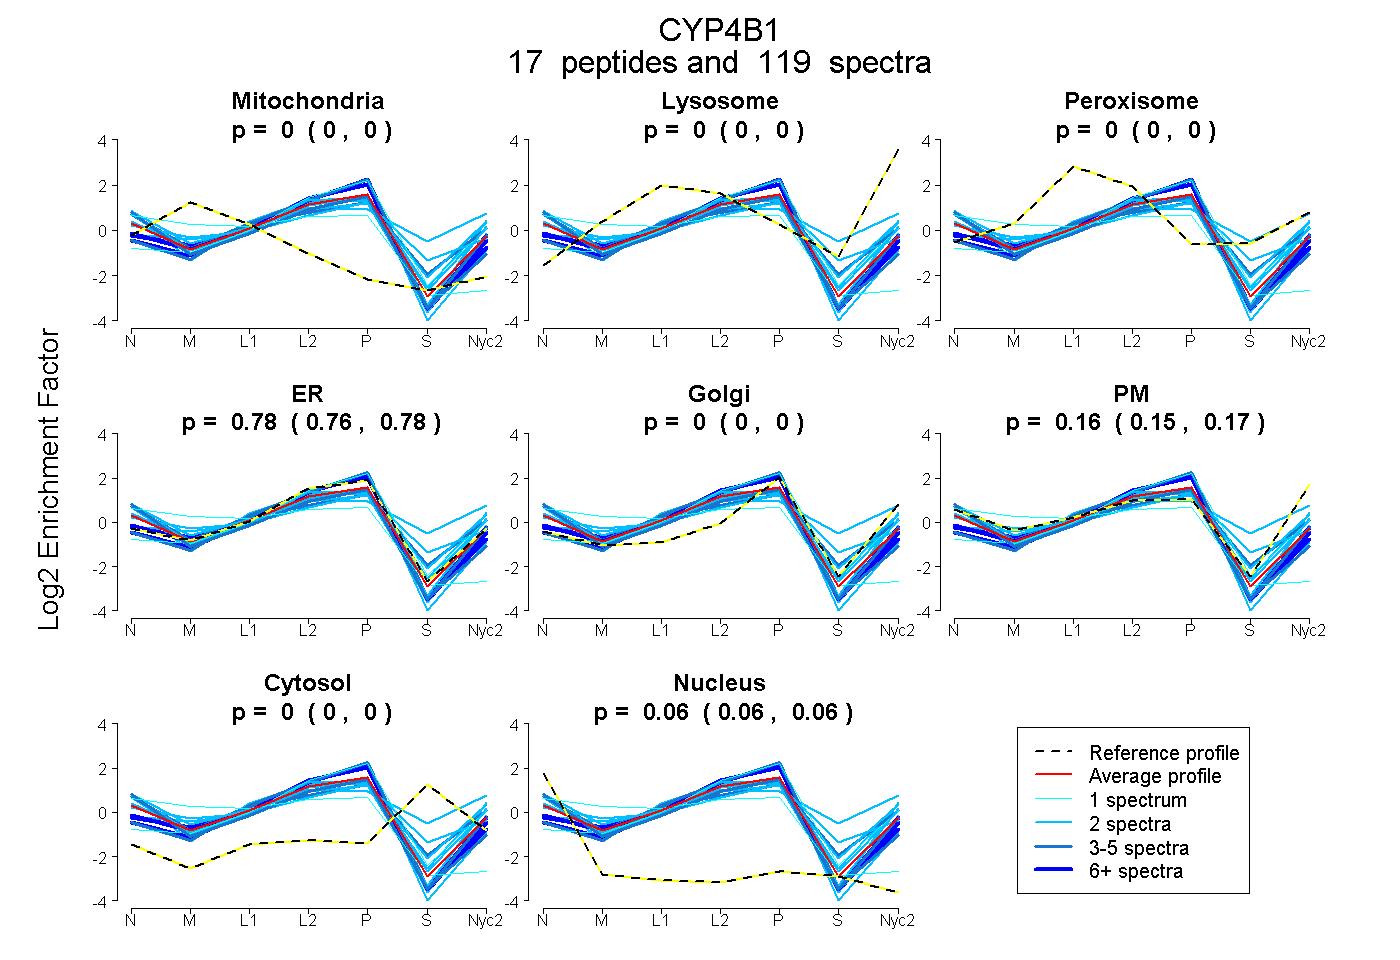
0.000 | 0.000
0.000 | 0.000
0.000 | 0.000
0.765 | 0.784
0.000 | 0.000
0.151 | 0.171
0.000 | 0.000
0.061 | 0.064
5peptides
spectra
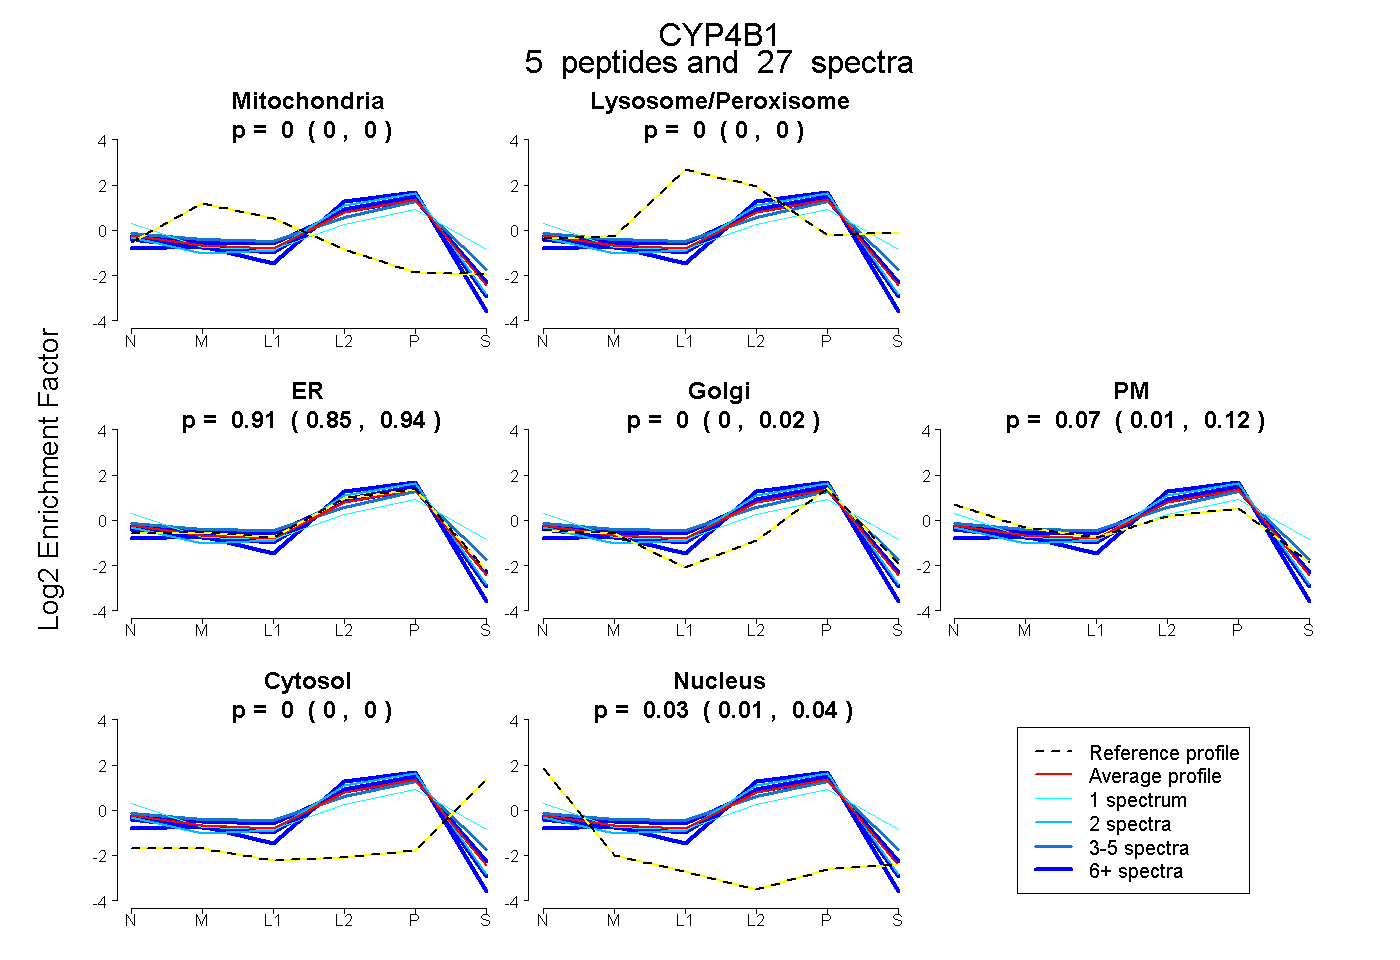
0.000 | 0.000
0.000 | 0.000
0.848 | 0.944
0.000 | 0.019
0.010 | 0.121
0.000 | 0.000
0.009 | 0.038
20peptides
spectra
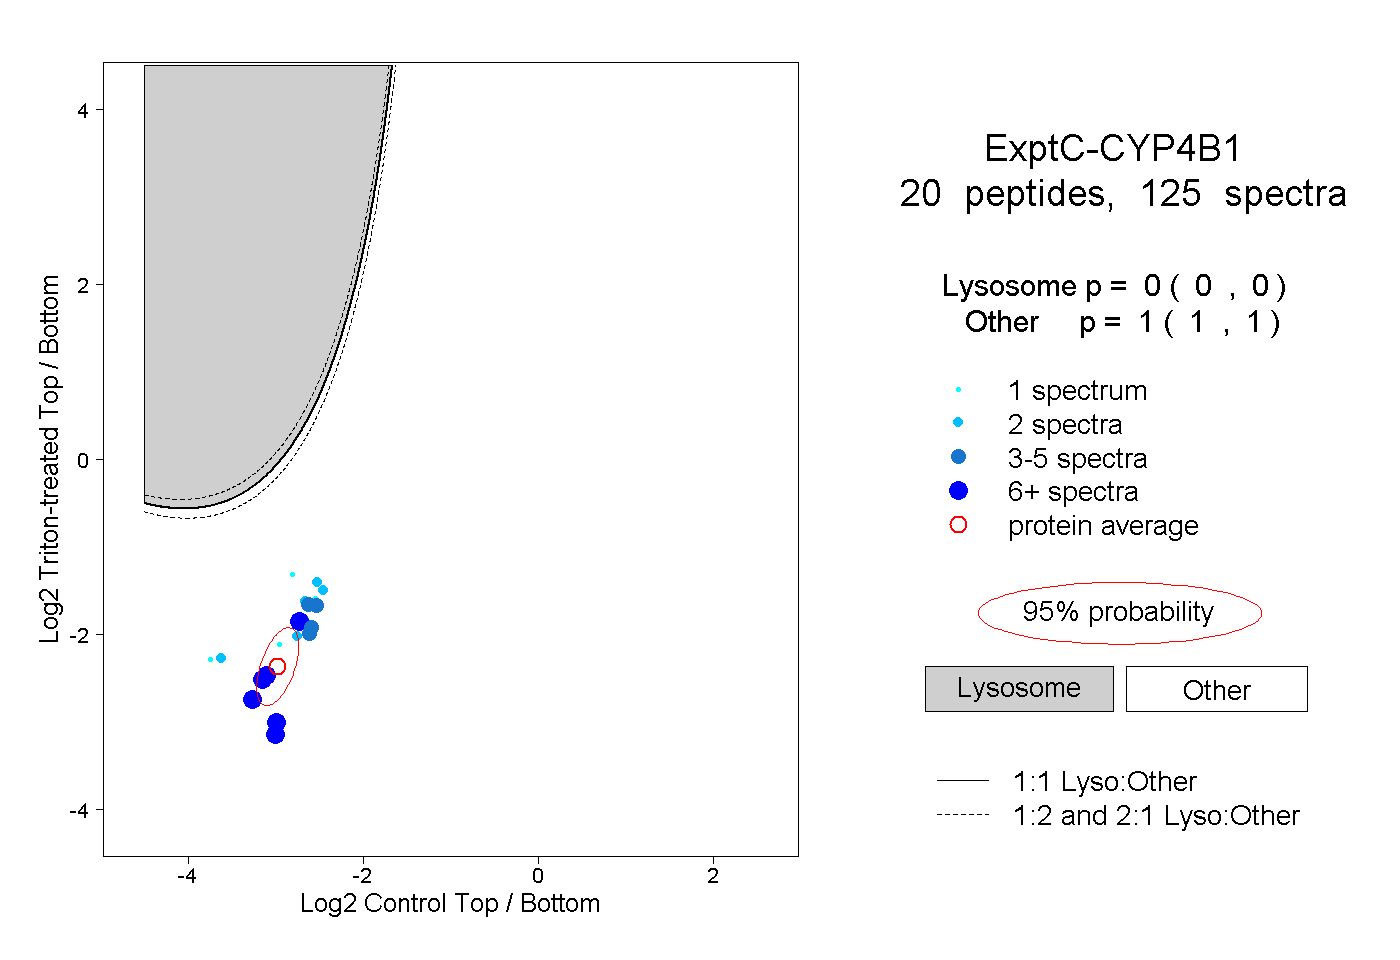
0.000 | 0.000
1.000 | 1.000
5peptides
spectra
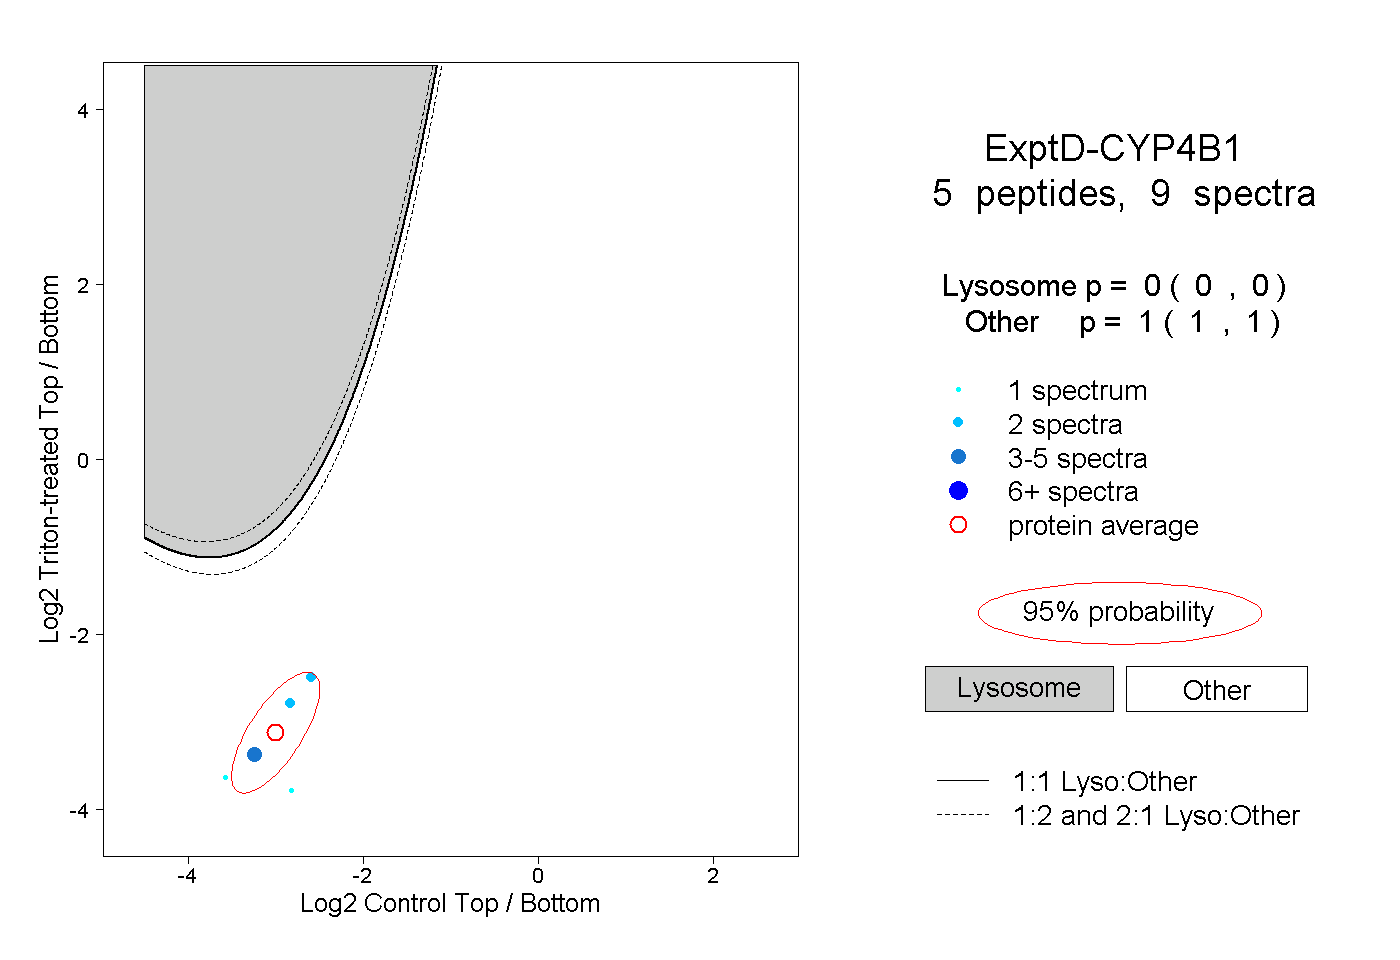
0.000 | 0.000
1.000 | 1.000