 10
10peptides
spectra
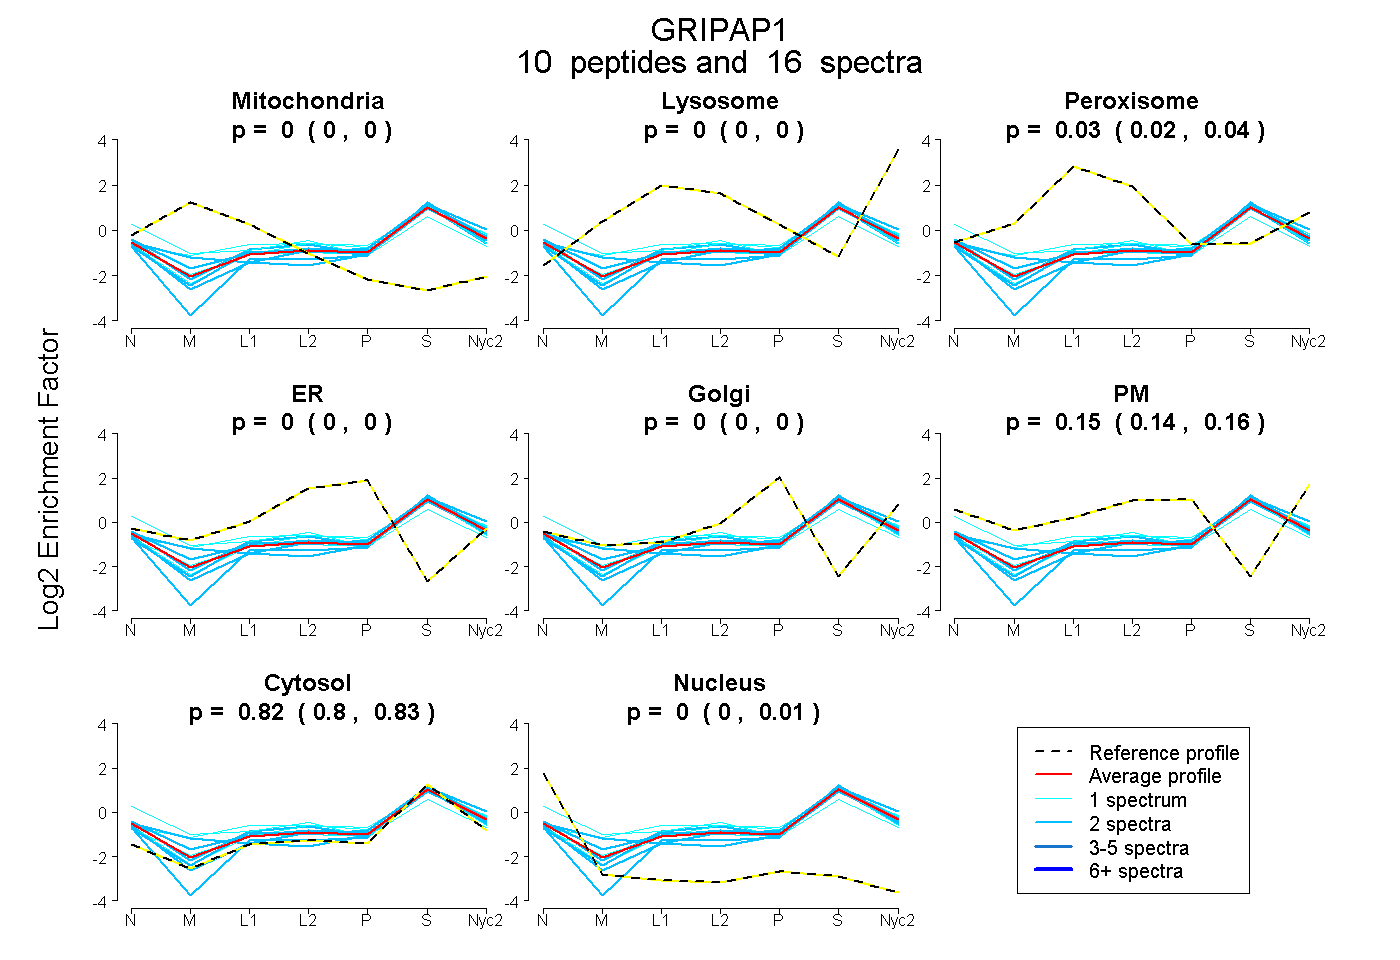
0.000 | 0.000
0.000 | 0.000
0.015 | 0.043
0.000 | 0.000
0.000 | 0.000
0.138 | 0.157
0.804 | 0.828
0.000 | 0.010
2peptides
spectra
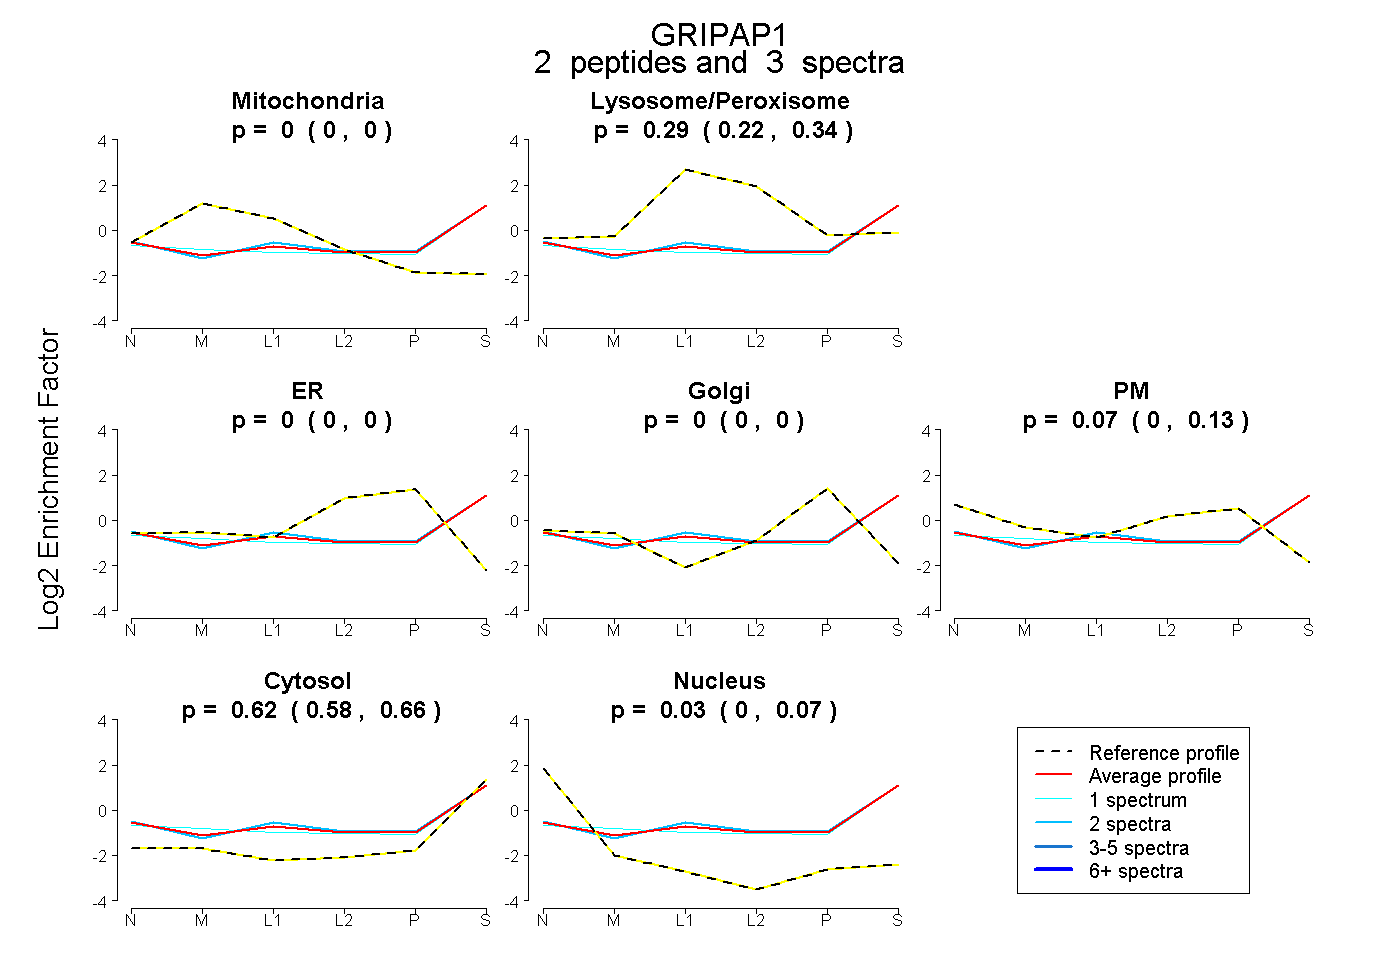
0.000 | 0.000
0.216 | 0.343
0.000 | 0.000
0.000 | 0.000
0.000 | 0.128
0.575 | 0.656
0.000 | 0.067
4peptides
spectra
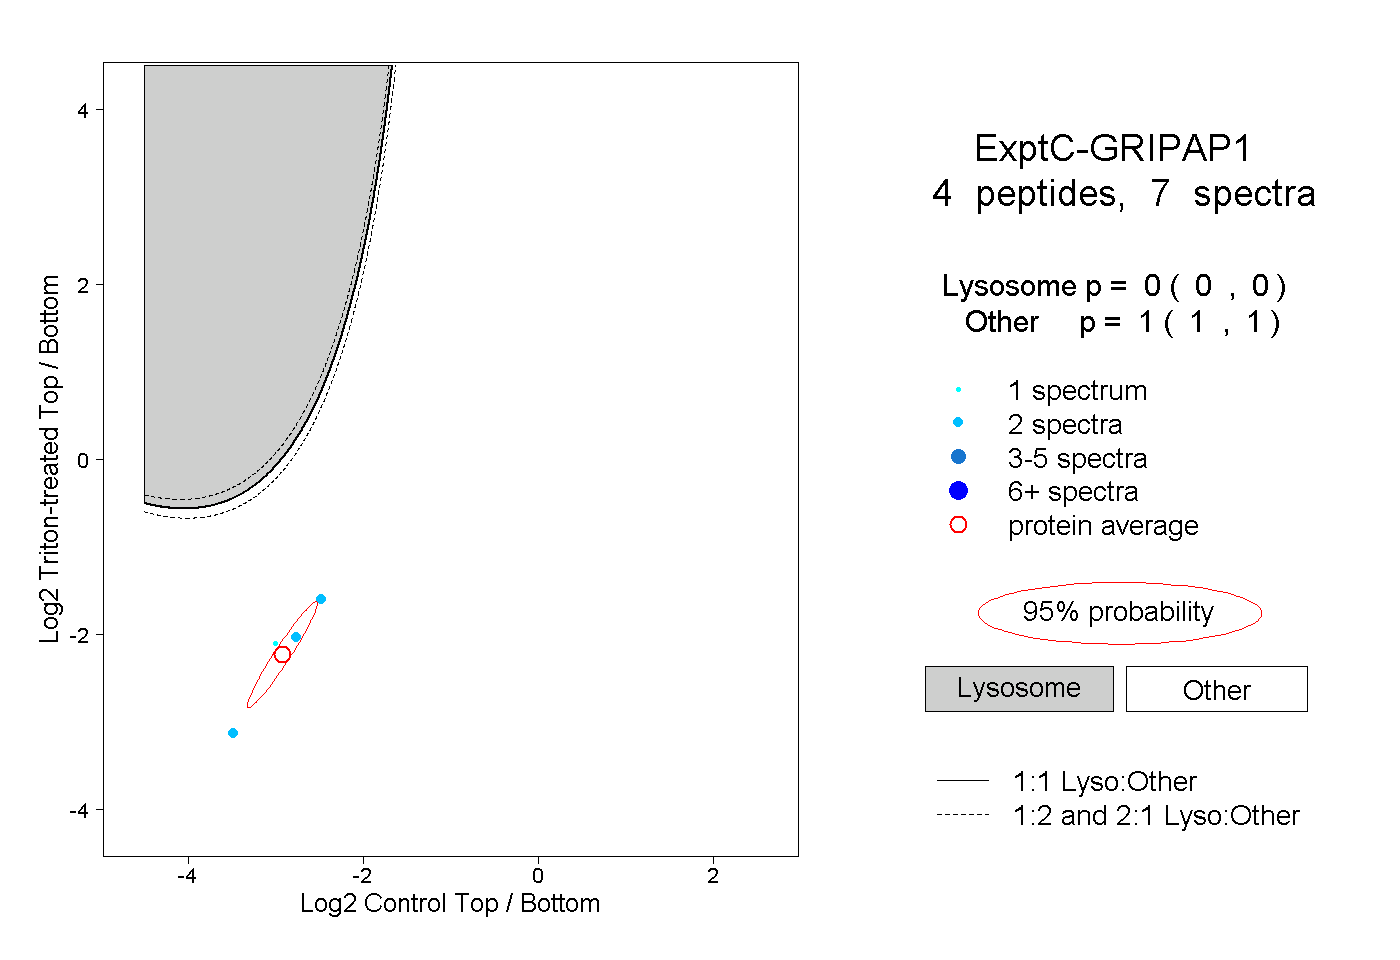
0.000 | 0.000
1.000 | 1.000
1peptide
spectrum
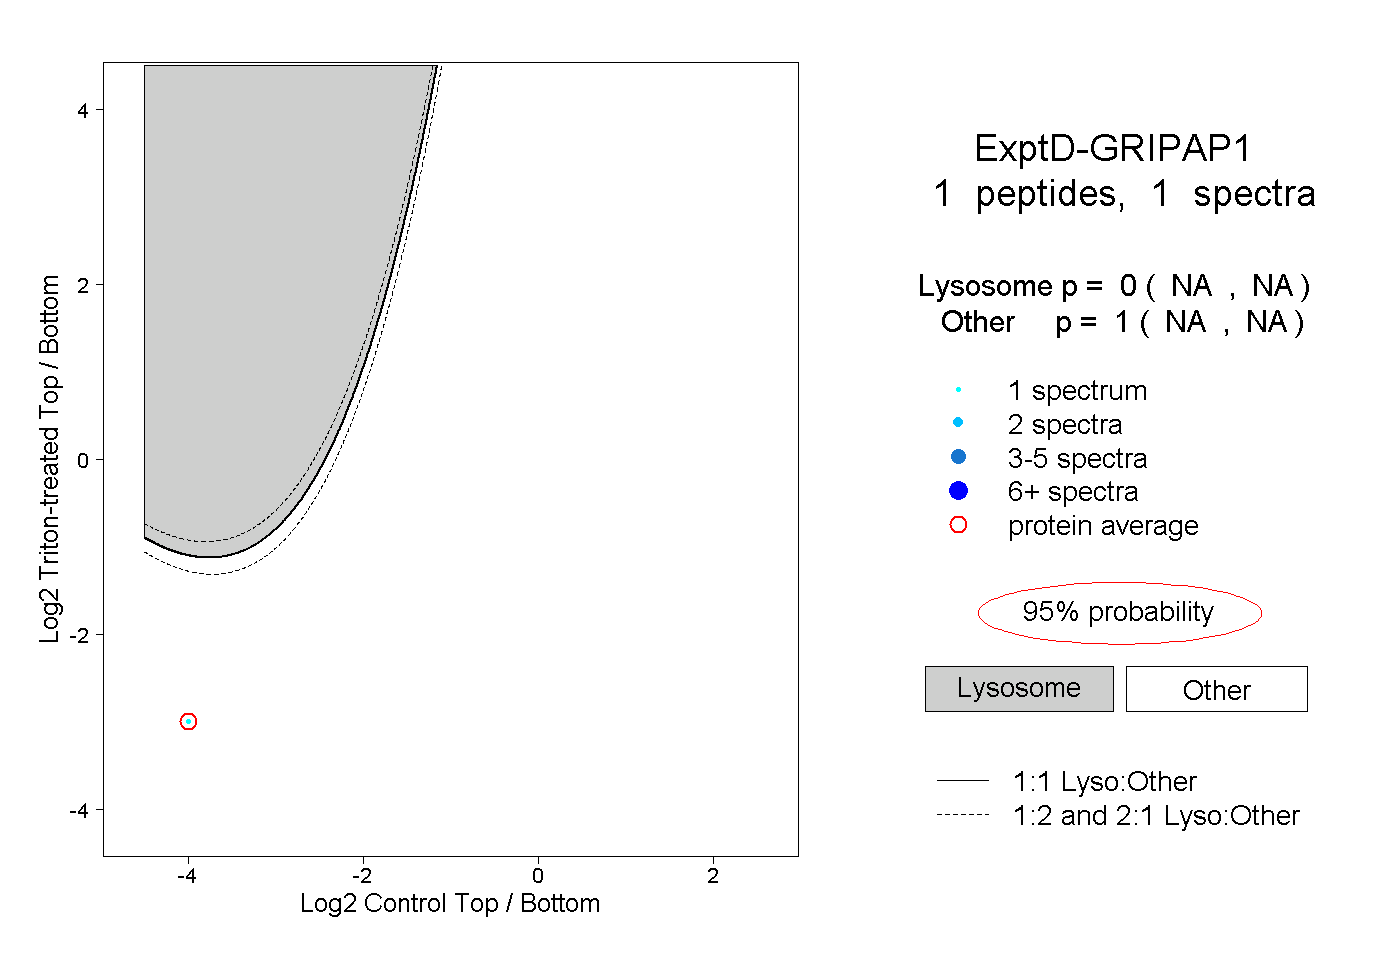
NA | NA
NA | NA