 10
10peptides
spectra
0.000 | 0.000
0.000 | 0.000
0.015 | 0.043
0.000 | 0.000
0.000 | 0.000
0.138 | 0.157
0.804 | 0.828
0.000 | 0.010
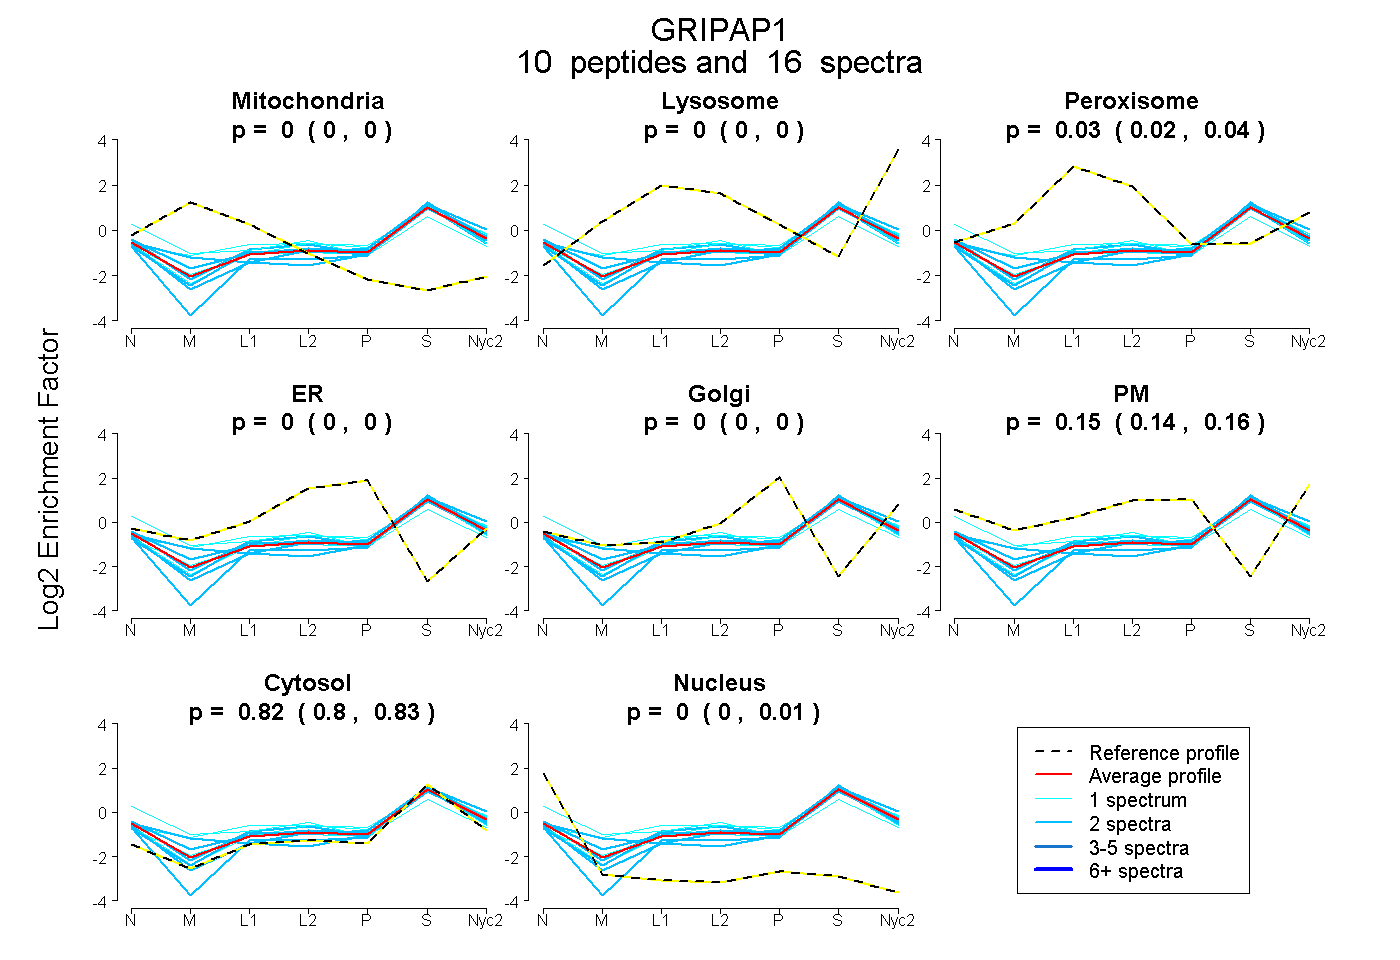
| Plot | Mito | Lyso | Perox | ER | Golgi | PM | Cytosol | Nucleus | |||||
| Expt A |
10 peptides |
16 spectra |
|
0.000 0.000 | 0.000 |
0.000 0.000 | 0.000 |
0.030 0.015 | 0.043 |
0.000 0.000 | 0.000 |
0.000 0.000 | 0.000 |
0.148 0.138 | 0.157 |
0.817 0.804 | 0.828 |
0.004 0.000 | 0.010 |
| 2 spectra, WMIEEK | 0.000 | 0.055 | 0.000 | 0.000 | 0.000 | 0.116 | 0.829 | 0.000 | ||
| 1 spectrum, DLVKPGDENLR | 0.003 | 0.008 | 0.174 | 0.000 | 0.000 | 0.131 | 0.683 | 0.000 | ||
| 1 spectrum, EQHAAELK | 0.022 | 0.000 | 0.223 | 0.000 | 0.000 | 0.097 | 0.528 | 0.130 | ||
| 2 spectra, EQLIQDLQEAR | 0.000 | 0.000 | 0.000 | 0.000 | 0.000 | 0.082 | 0.890 | 0.028 | ||
| 1 spectrum, NMHLHK | 0.000 | 0.000 | 0.066 | 0.036 | 0.000 | 0.091 | 0.807 | 0.000 | ||
| 2 spectra, DMEVLSQEIVR | 0.000 | 0.000 | 0.000 | 0.000 | 0.000 | 0.020 | 0.959 | 0.021 | ||
| 2 spectra, ECVGSPDPDLEPGEAN | 0.000 | 0.000 | 0.119 | 0.000 | 0.000 | 0.074 | 0.778 | 0.030 | ||
| 2 spectra, LEHAAALR | 0.078 | 0.000 | 0.000 | 0.000 | 0.000 | 0.162 | 0.760 | 0.000 | ||
| 1 spectrum, DTVDGQR | 0.000 | 0.000 | 0.015 | 0.000 | 0.000 | 0.132 | 0.853 | 0.000 | ||
| 2 spectra, EGVPGAAGPHVDGELLR | 0.000 | 0.000 | 0.082 | 0.000 | 0.000 | 0.132 | 0.757 | 0.028 |
| Plot | Mito | Lyso or Perox | ER | Golgi | PM | Cytosol | Nucleus | ||||||
| Expt B |
2 peptides |
3 spectra |
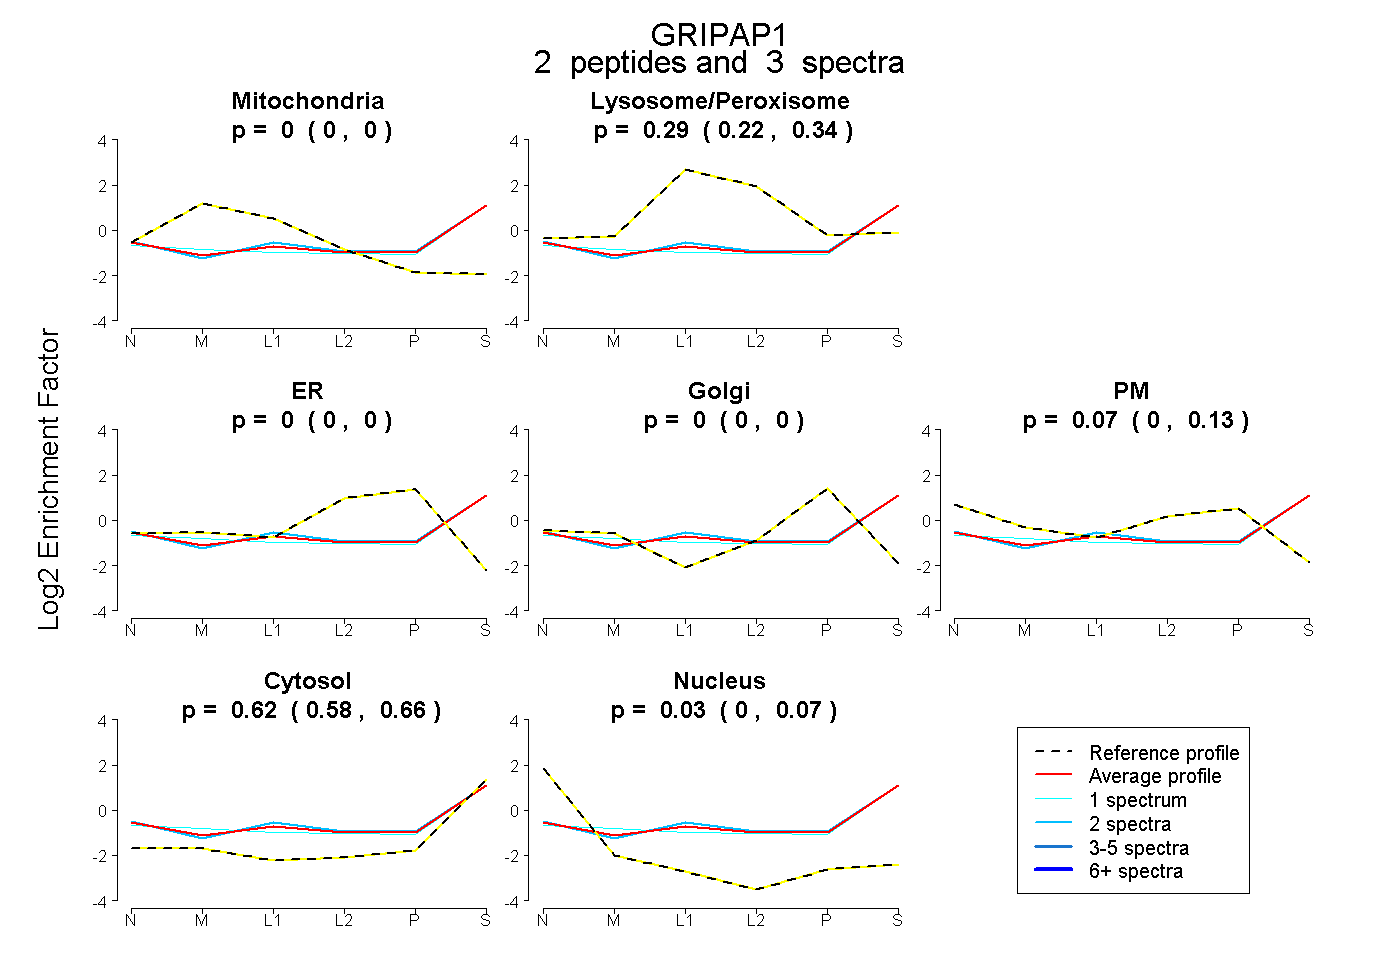 |
0.000 0.000 | 0.000 |
0.285 0.216 | 0.343 |
0.000 0.000 | 0.000 |
0.000 0.000 | 0.000 |
0.066 0.000 | 0.128 |
0.619 0.575 | 0.656 |
0.029 0.000 | 0.067 |
|||
| Plot | Lyso | Other | |||||||||||
| Expt C |
4 peptides |
7 spectra |
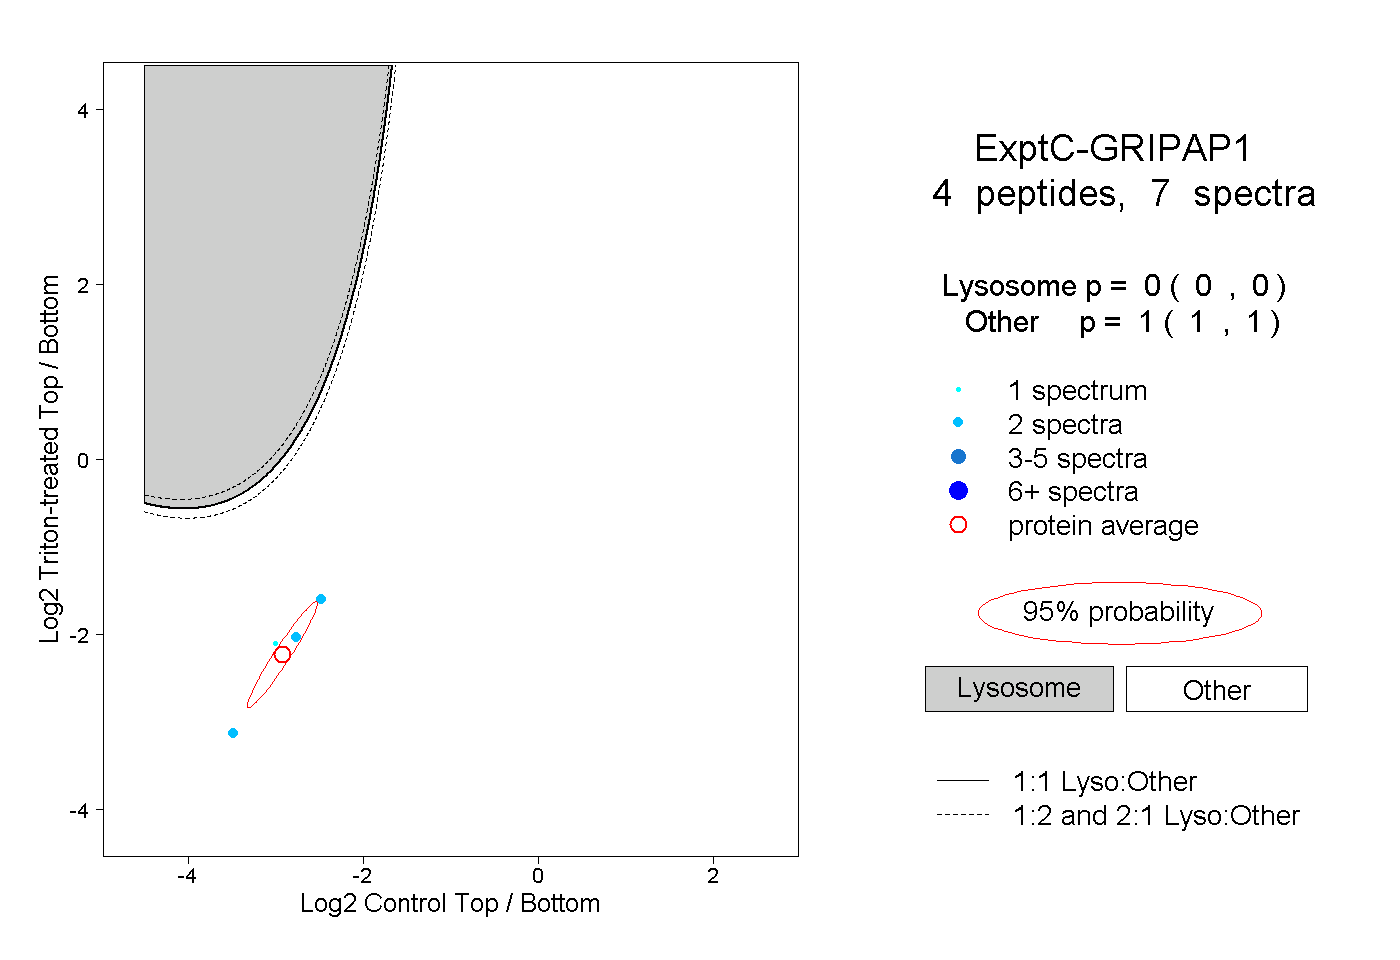 |
0.000 0.000 | 0.000 |
1.000 1.000 | 1.000 |
||||||||
| Plot | Lyso | Other | |||||||||||
| Expt D |
1 peptide |
1 spectrum |
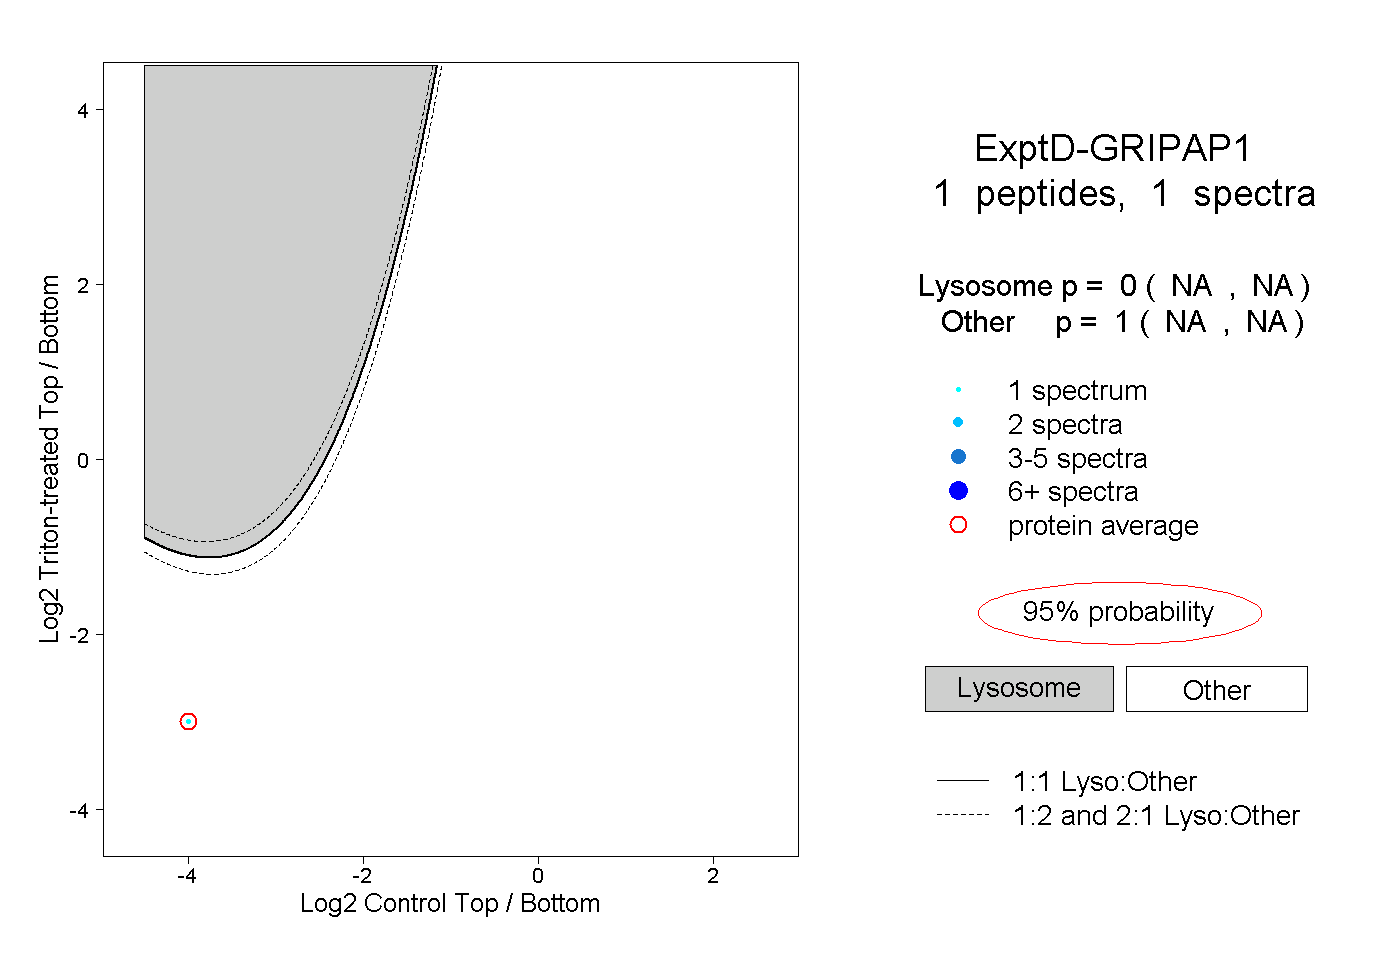 |
0.000 NA | NA |
1.000 NA | NA |