PTCD3
[ENSRNOP00000012622]
Main page
| | | Plot |
Mito |
Lyso |
|
Perox |
ER |
Golgi |
PM |
Cytosol |
Nucleus |
|
| Expt A |
 13
13
peptides |
35
spectra |
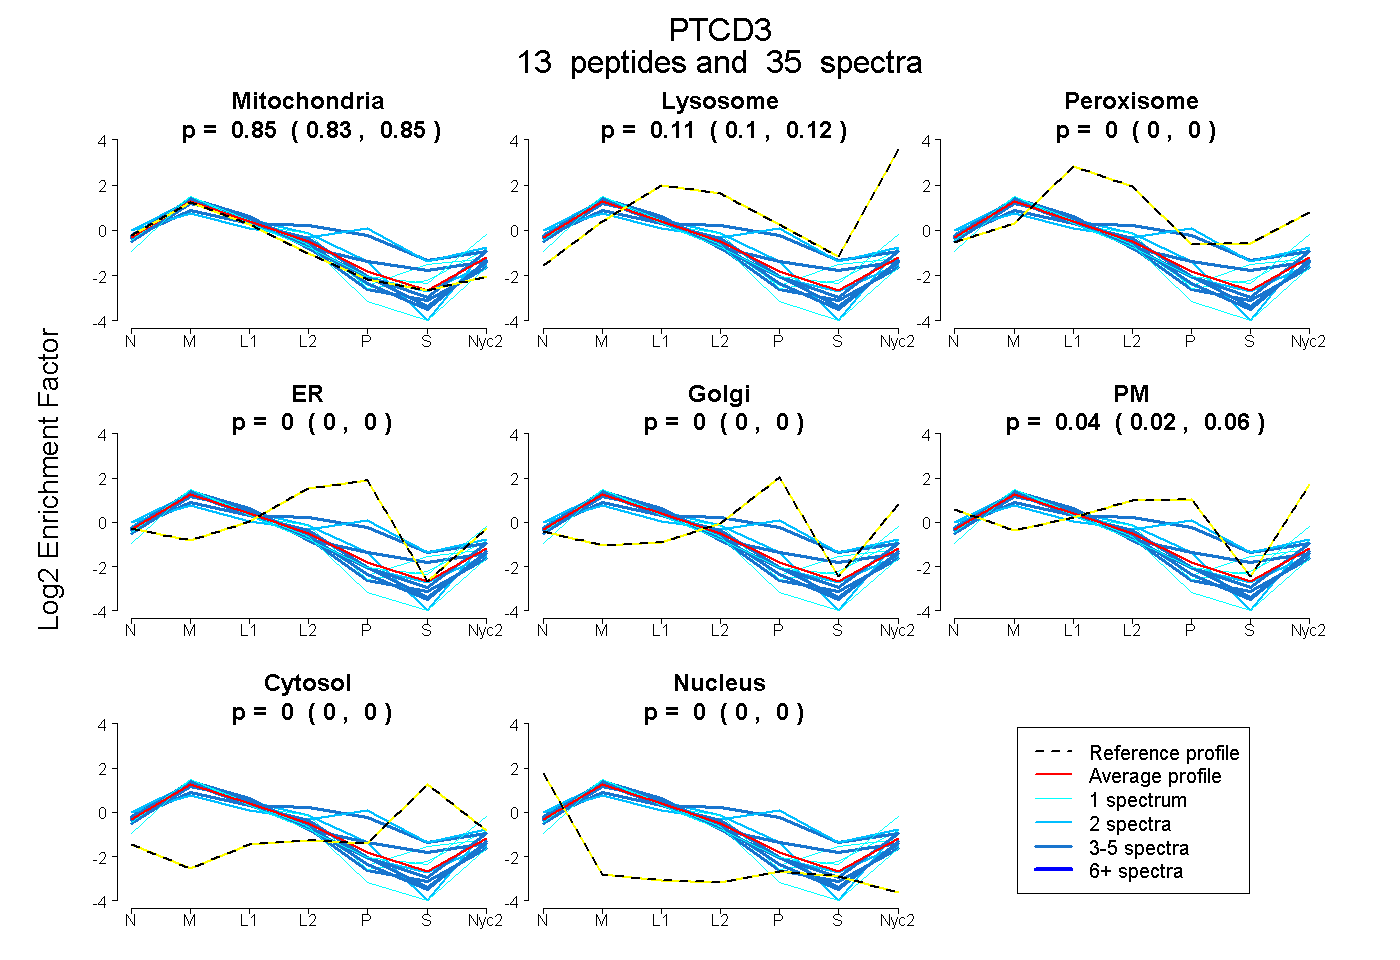 |
0.845
0.835 | 0.854 |
0.113
0.101 | 0.122 |
|
0.000
0.000 | 0.000 |
0.000
0.000 | 0.000 |
0.000
0.000 | 0.000 |
0.042
0.024 | 0.057 |
0.000
0.000 | 0.000 |
0.000
0.000 | 0.000 |
|
| | | Plot |
Mito |
|
Lyso or Perox |
|
ER |
Golgi |
PM |
Cytosol |
Nucleus |
|
| Expt B |
5
peptides |
7
spectra |
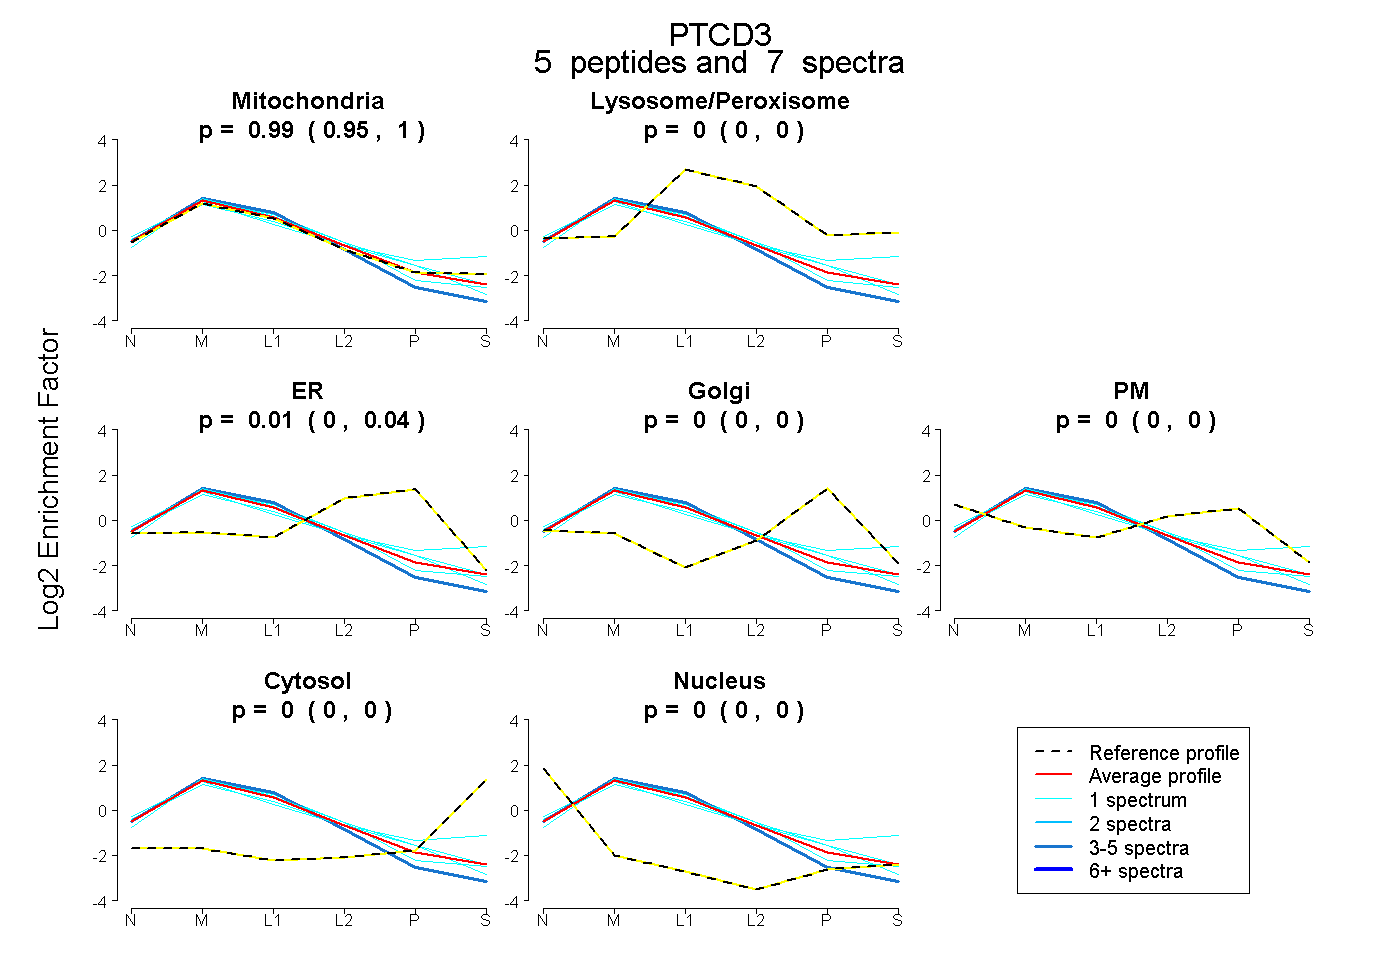 |
0.986
0.954 | 1.000 |
|
0.000
0.000 | 0.000 |
|
0.014
0.000 | 0.041 |
0.000
0.000 | 0.000 |
0.000
0.000 | 0.000 |
0.000
0.000 | 0.000 |
0.000
0.000 | 0.000 |
|
| 3 spectra, LPALQILR |
1.000 |
|
0.000 |
|
0.000 |
0.000 |
0.000 |
0.000 |
0.000 |
|
| 1 spectrum, WNDILDLLR |
1.000 |
|
0.000 |
|
0.000 |
0.000 |
0.000 |
0.000 |
0.000 |
|
| 1 spectrum, LIGPDSQR |
0.760 |
|
0.117 |
|
0.000 |
0.044 |
0.000 |
0.079 |
0.000 |
|
| 1 spectrum, FIINSHPK |
0.929 |
|
0.000 |
|
0.071 |
0.000 |
0.000 |
0.000 |
0.000 |
|
| 1 spectrum, STYENQDAR |
0.877 |
|
0.000 |
|
0.000 |
0.000 |
0.123 |
0.000 |
0.000 |
|
| | | Plot |
|
Lyso |
|
|
|
|
|
|
|
Other |
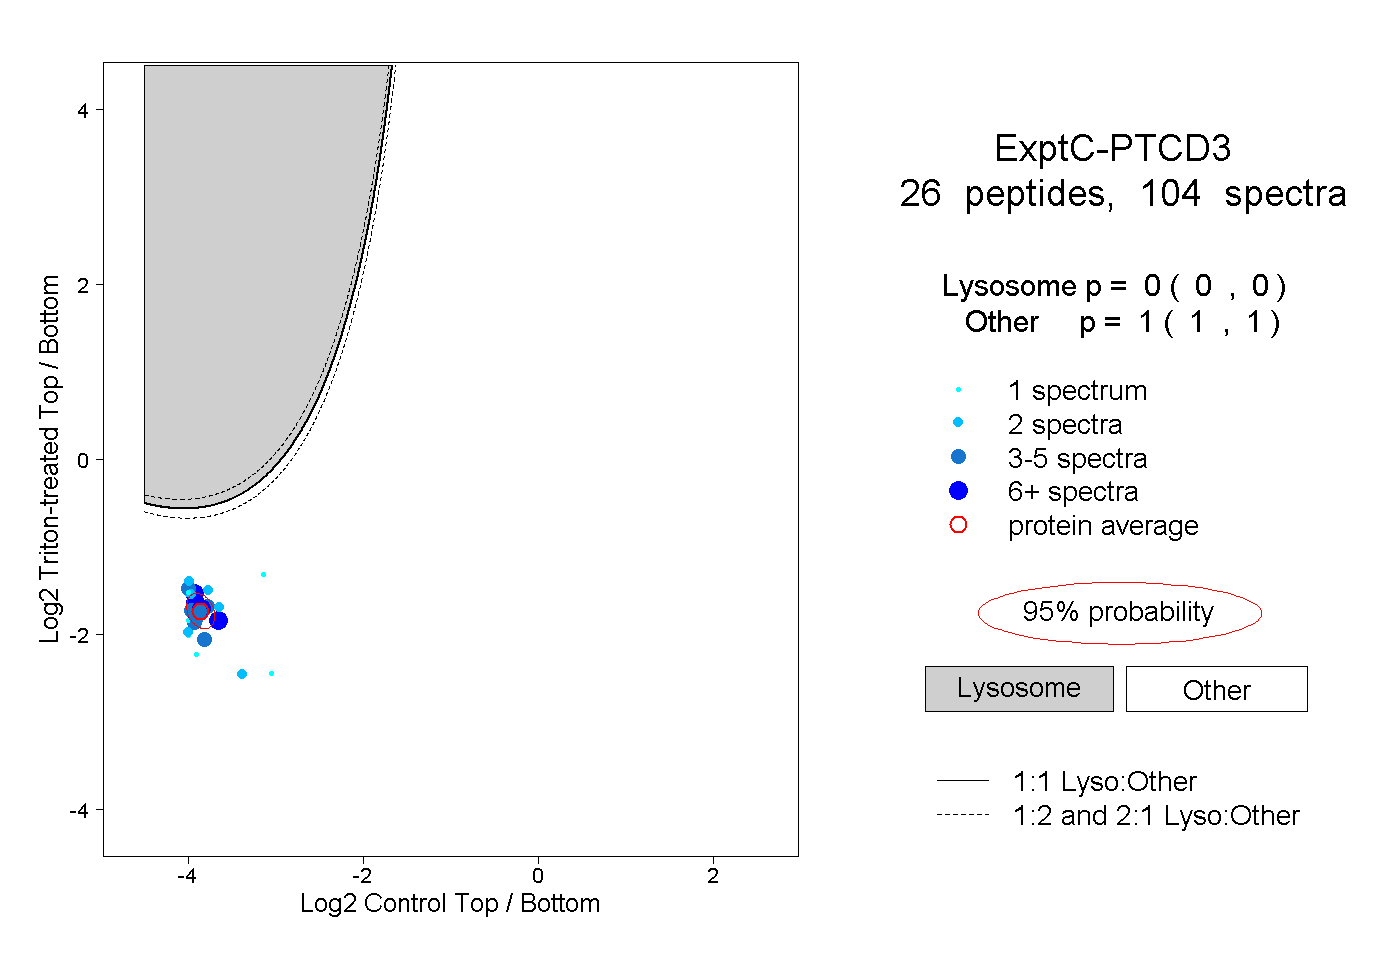
| Expt C |
26
peptides |
104
spectra |
 |
|
0.000
0.000 | 0.000 |
|
|
|
|
|
|
|
1.000
1.000 | 1.000 |
| | | Plot |
|
Lyso |
|
|
|
|
|
|
|
Other |
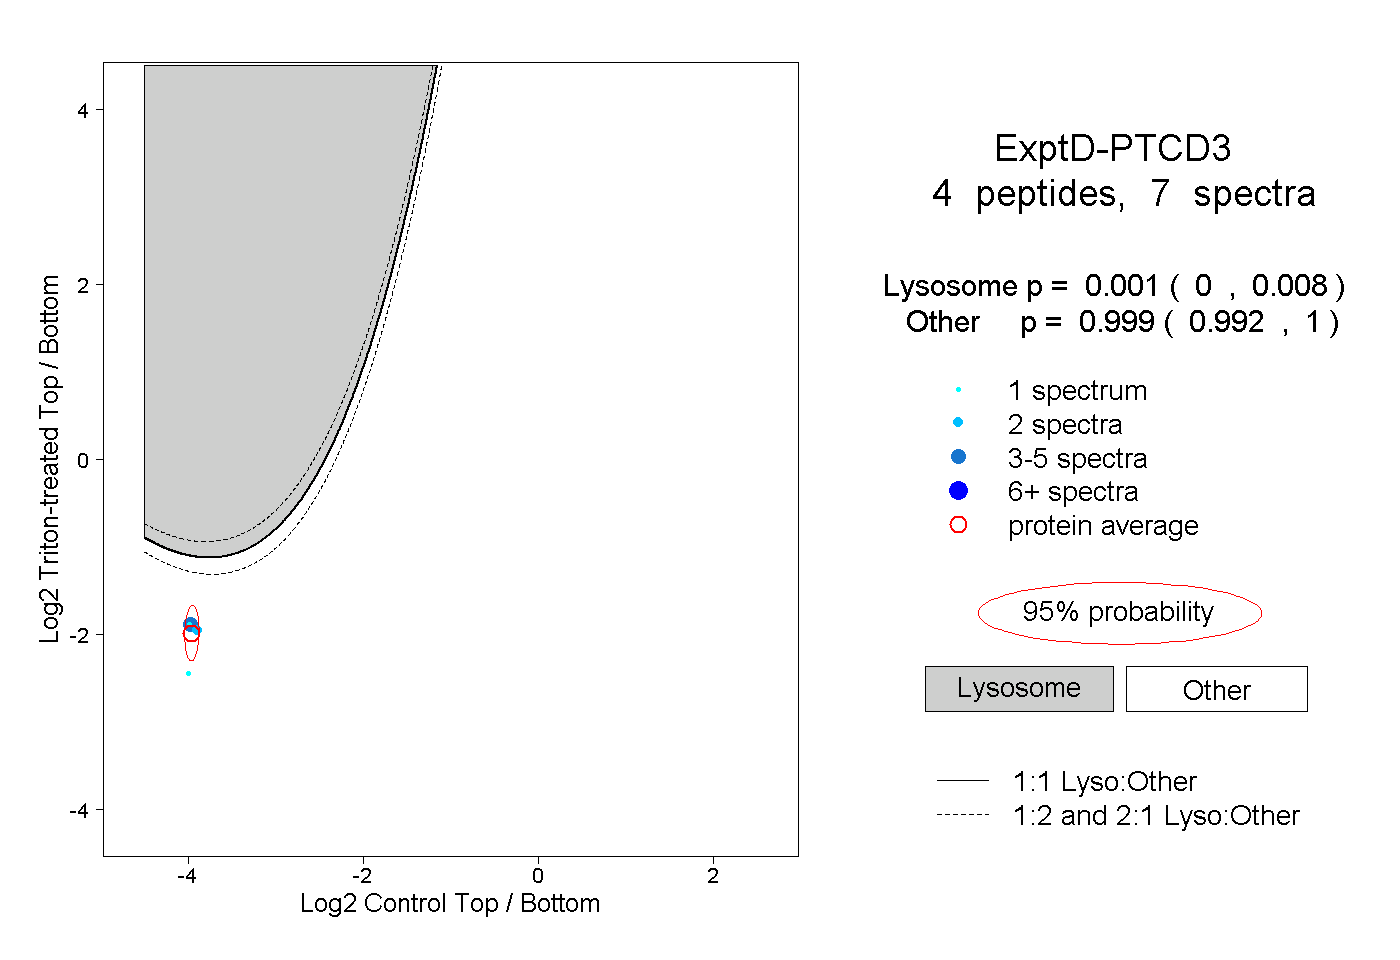
| Expt D |
4
peptides |
7
spectra |
 |
|
0.001
0.000 | 0.008 |
|
|
|
|
|
|
|
0.999
0.992 | 1.000 |