 3
3peptides
spectra

0.000 | 0.000
0.048 | 0.133
0.000 | 0.117
0.000 | 0.000
0.000 | 0.174
0.000 | 0.213
0.610 | 0.678
0.000 | 0.000
1peptide
spectra
0.000 | 0.000
1.000 | 1.000
| Plot | Mito | Lyso | Perox | ER | Golgi | PM | Cytosol | Nucleus | |||||
| Expt A |
3 peptides |
7 spectra |
|
0.000 0.000 | 0.000 |
0.094 0.048 | 0.133 |
0.063 0.000 | 0.117 |
0.000 0.000 | 0.000 |
0.089 0.000 | 0.174 |
0.107 0.000 | 0.213 |
0.647 0.610 | 0.678 |
0.000 0.000 | 0.000 |
||
| Plot | Lyso | Other | |||||||||||
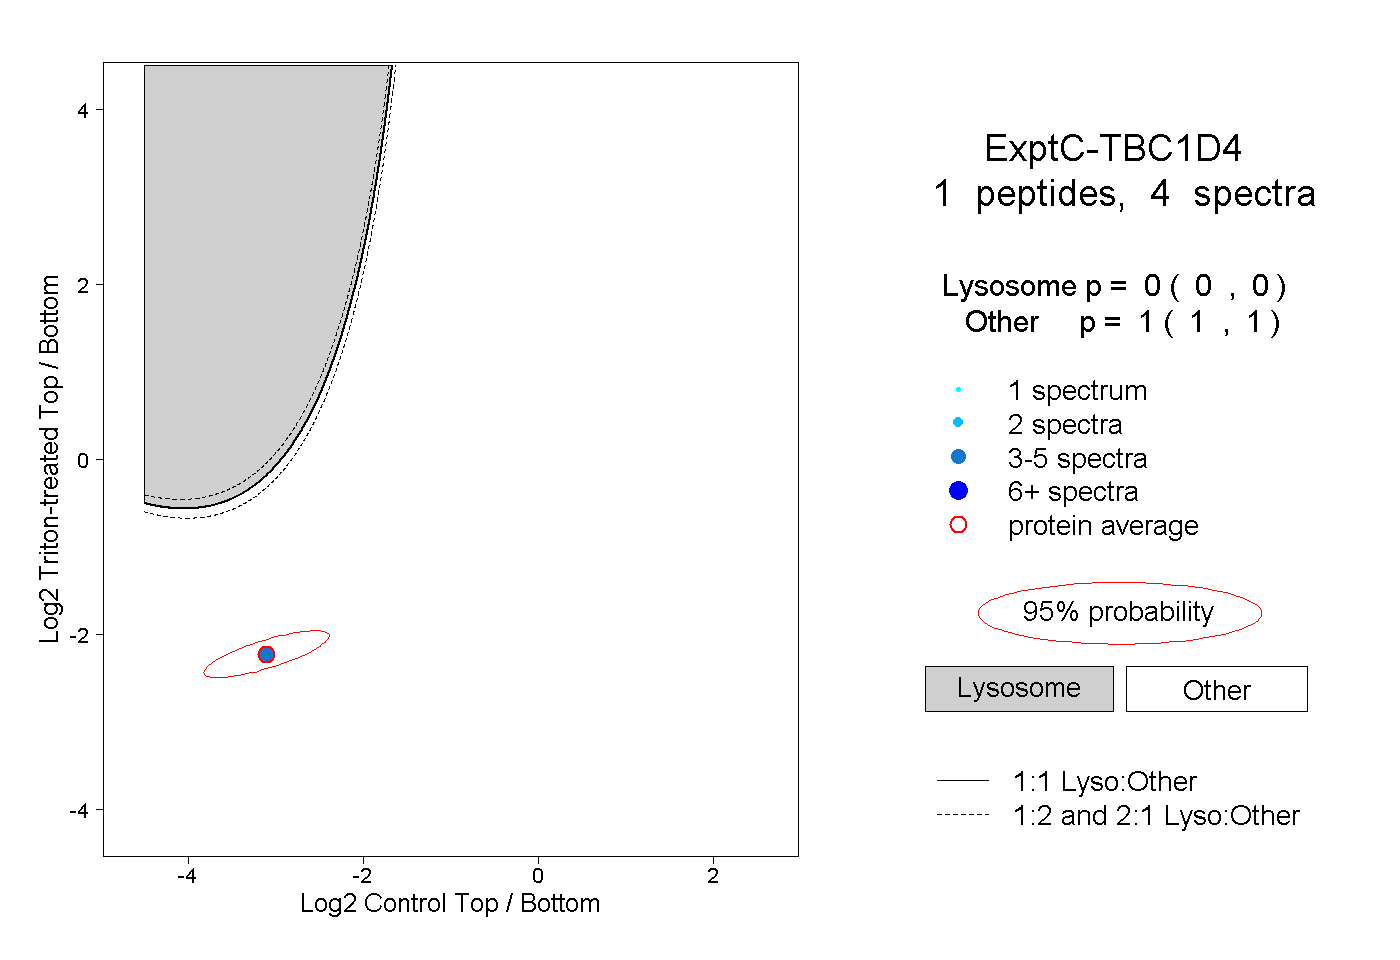
| Expt C |
1 peptide |
4 spectra |
|
0.000 0.000 | 0.000 |
1.000 1.000 | 1.000 |