 3
3peptides
spectra
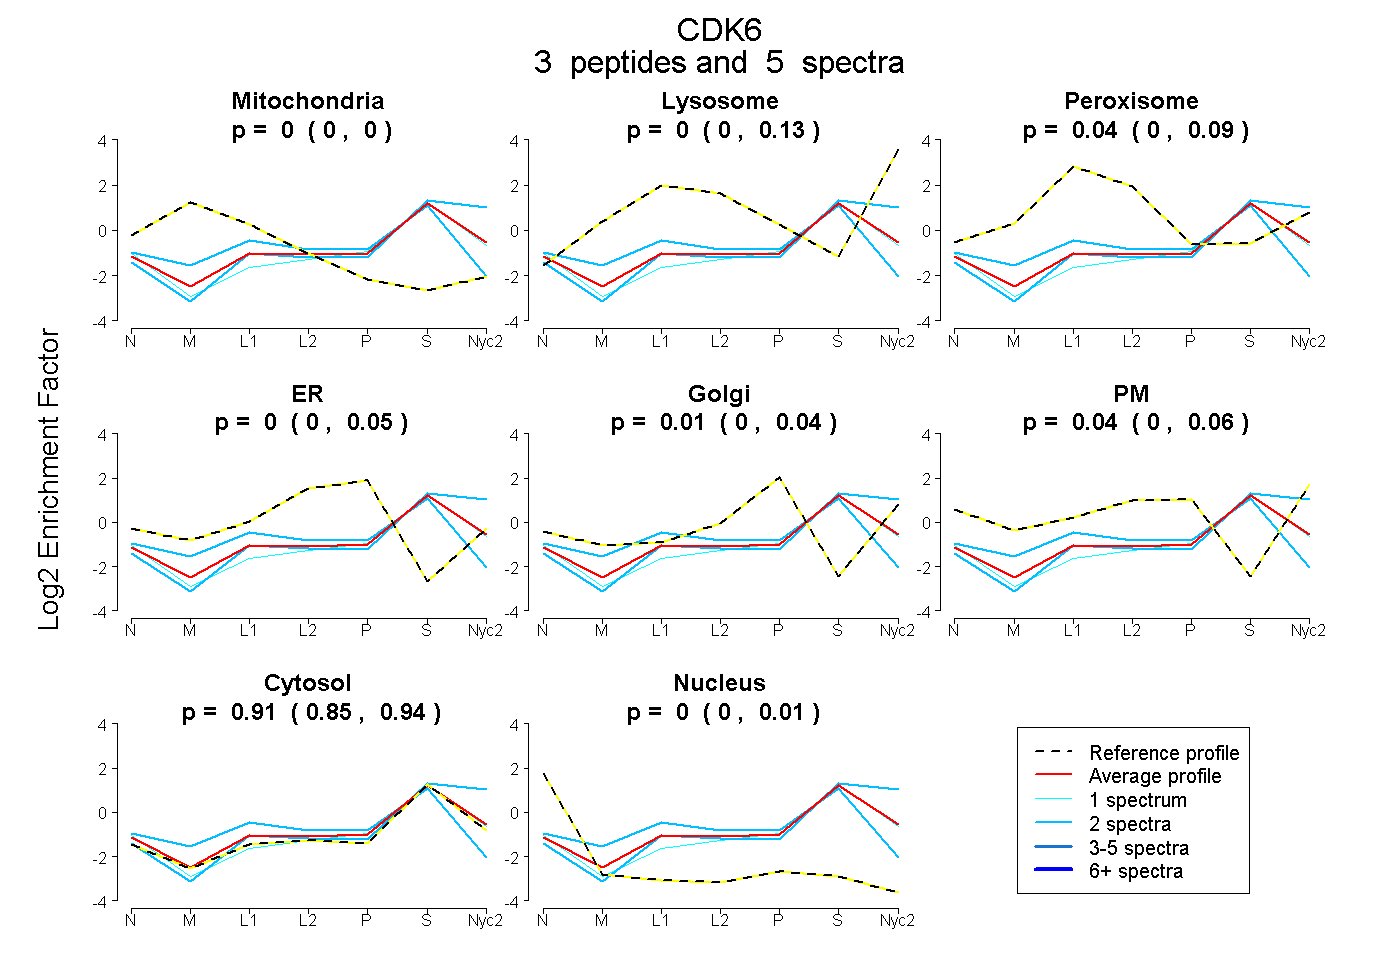
0.000 | 0.000
0.000 | 0.127
0.000 | 0.086
0.000 | 0.054
0.000 | 0.036
0.000 | 0.060
0.854 | 0.938
0.000 | 0.014
1peptide
spectrum
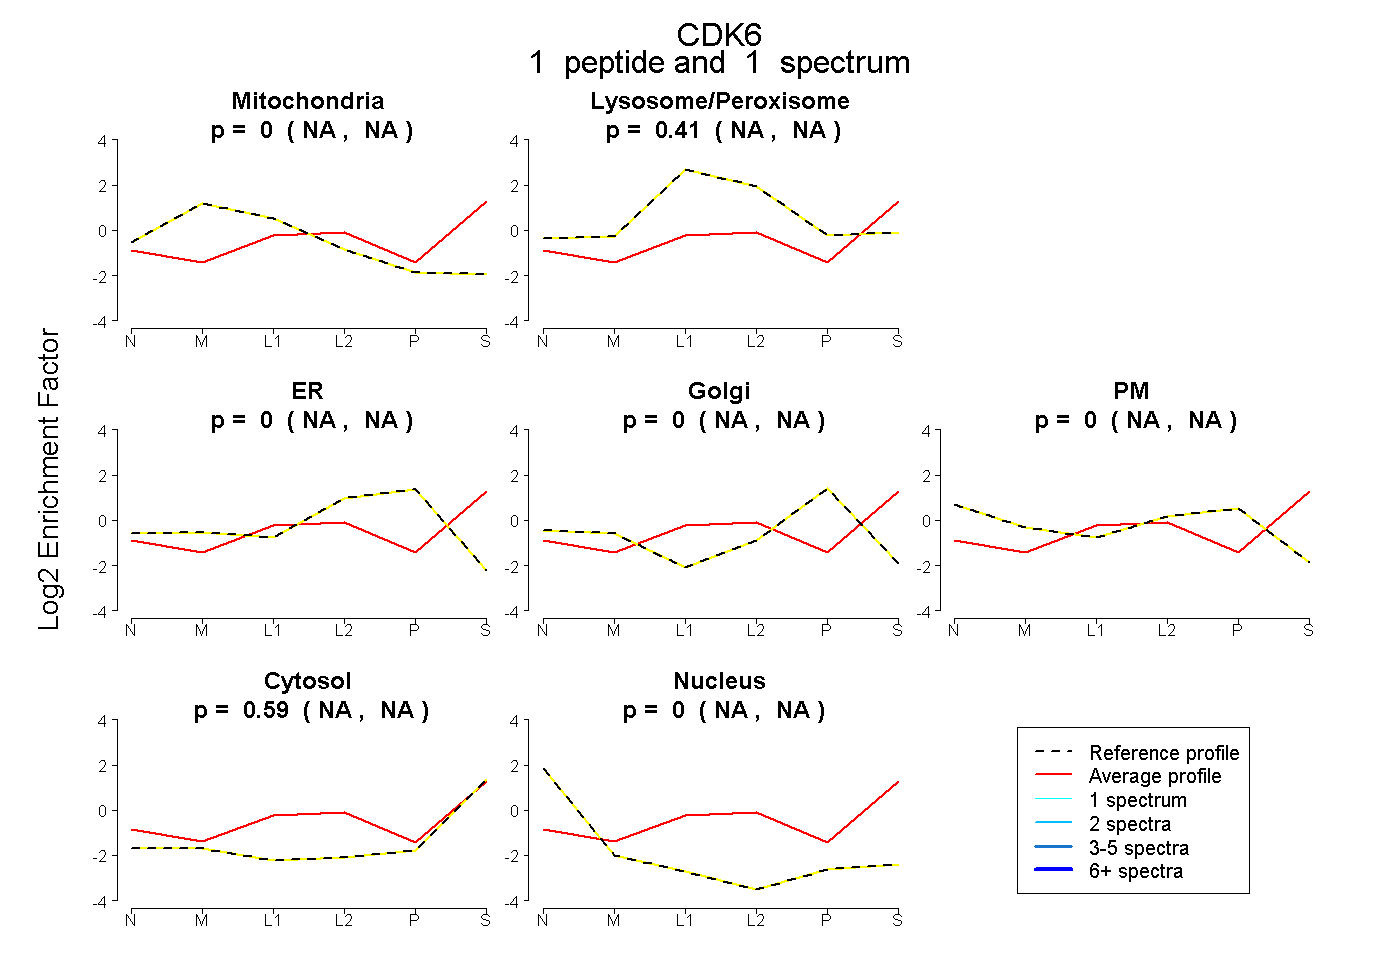
NA | NA
NA | NA
NA | NA
NA | NA
NA | NA
NA | NA
NA | NA
1peptide
spectrum

NA | NA
NA | NA
1peptide
spectrum

NA | NA
NA | NA