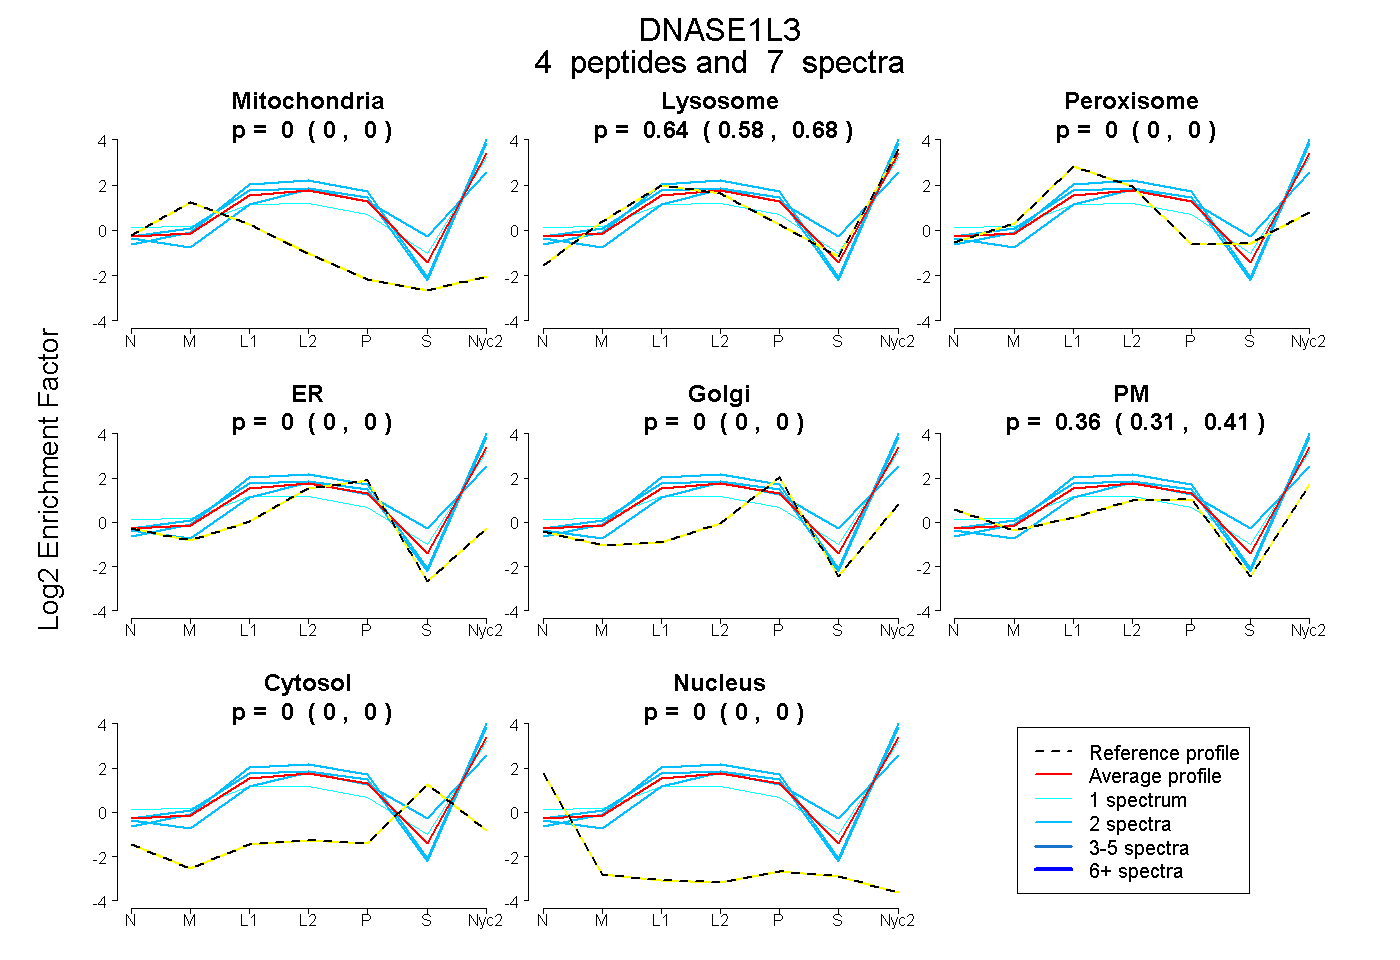
 4
4peptides
spectra
0.000 | 0.000
0.584 | 0.684
0.000 | 0.000
0.000 | 0.000
0.000 | 0.000
0.310 | 0.408
0.000 | 0.000
0.000 | 0.000
| Plot | Mito | Lyso | Perox | ER | Golgi | PM | Cytosol | Nucleus | |||||
| Expt A |
4 peptides |
7 spectra |
|
0.000 0.000 | 0.000 |
0.638 0.584 | 0.684 |
0.000 0.000 | 0.000 |
0.000 0.000 | 0.000 |
0.000 0.000 | 0.000 |
0.362 0.310 | 0.408 |
0.000 0.000 | 0.000 |
0.000 0.000 | 0.000 |
| 1 spectrum, EQYAFLYK | 0.000 | 0.565 | 0.000 | 0.000 | 0.000 | 0.435 | 0.000 | 0.000 | ||
| 2 spectra, STSCAYDR | 0.000 | 0.660 | 0.000 | 0.000 | 0.000 | 0.340 | 0.000 | 0.000 | ||
| 2 spectra, GQEIVNSVVPR | 0.000 | 0.761 | 0.000 | 0.000 | 0.000 | 0.239 | 0.000 | 0.000 | ||
| 2 spectra, LCSFNVR | 0.000 | 0.577 | 0.018 | 0.125 | 0.000 | 0.190 | 0.089 | 0.000 |
| Plot | Lyso | Other | |||||||||||
| Expt C |
4 peptides |
5 spectra |
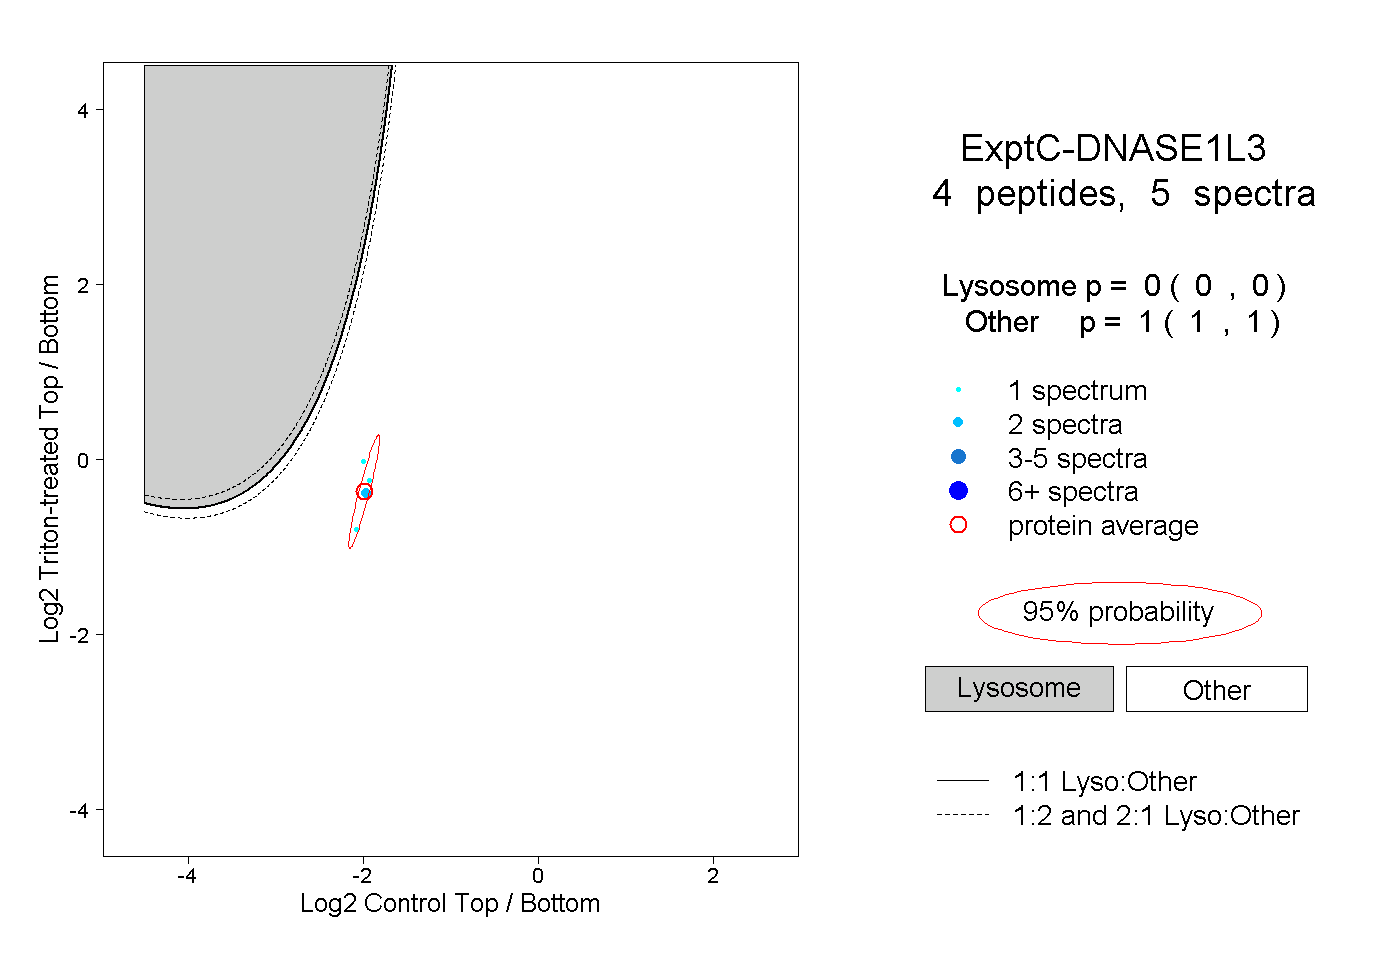 |
0.000 0.000 | 0.000 |
1.000 1.000 | 1.000 |
||||||||
| Plot | Lyso | Other | |||||||||||
| Expt D |
2 peptides |
3 spectra |
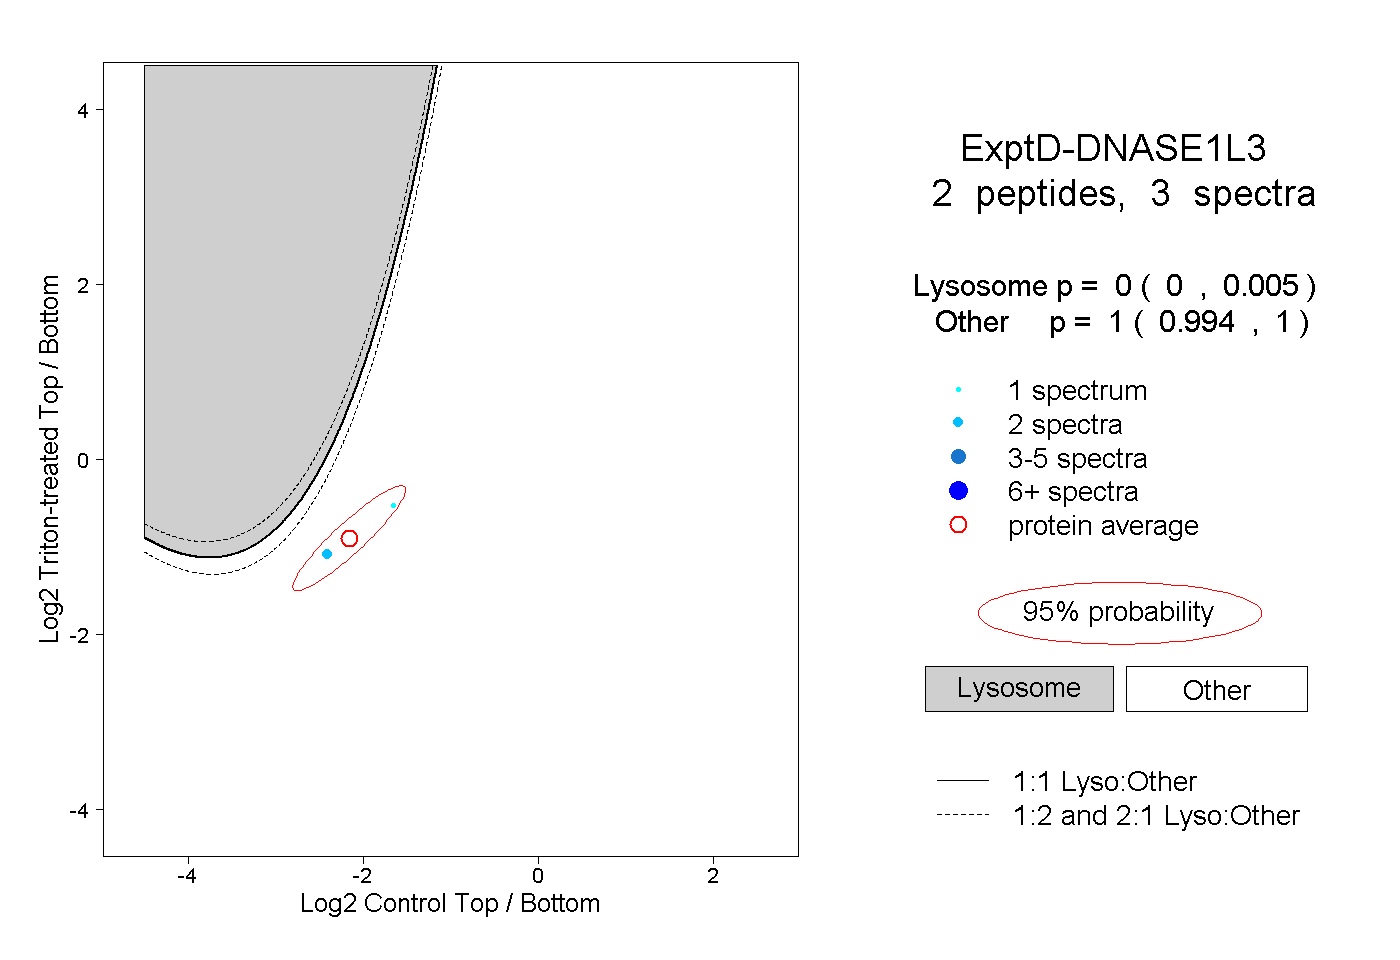 |
0.000 0.000 | 0.005 |
1.000 0.994 | 1.000 |