 3
3peptides
spectra
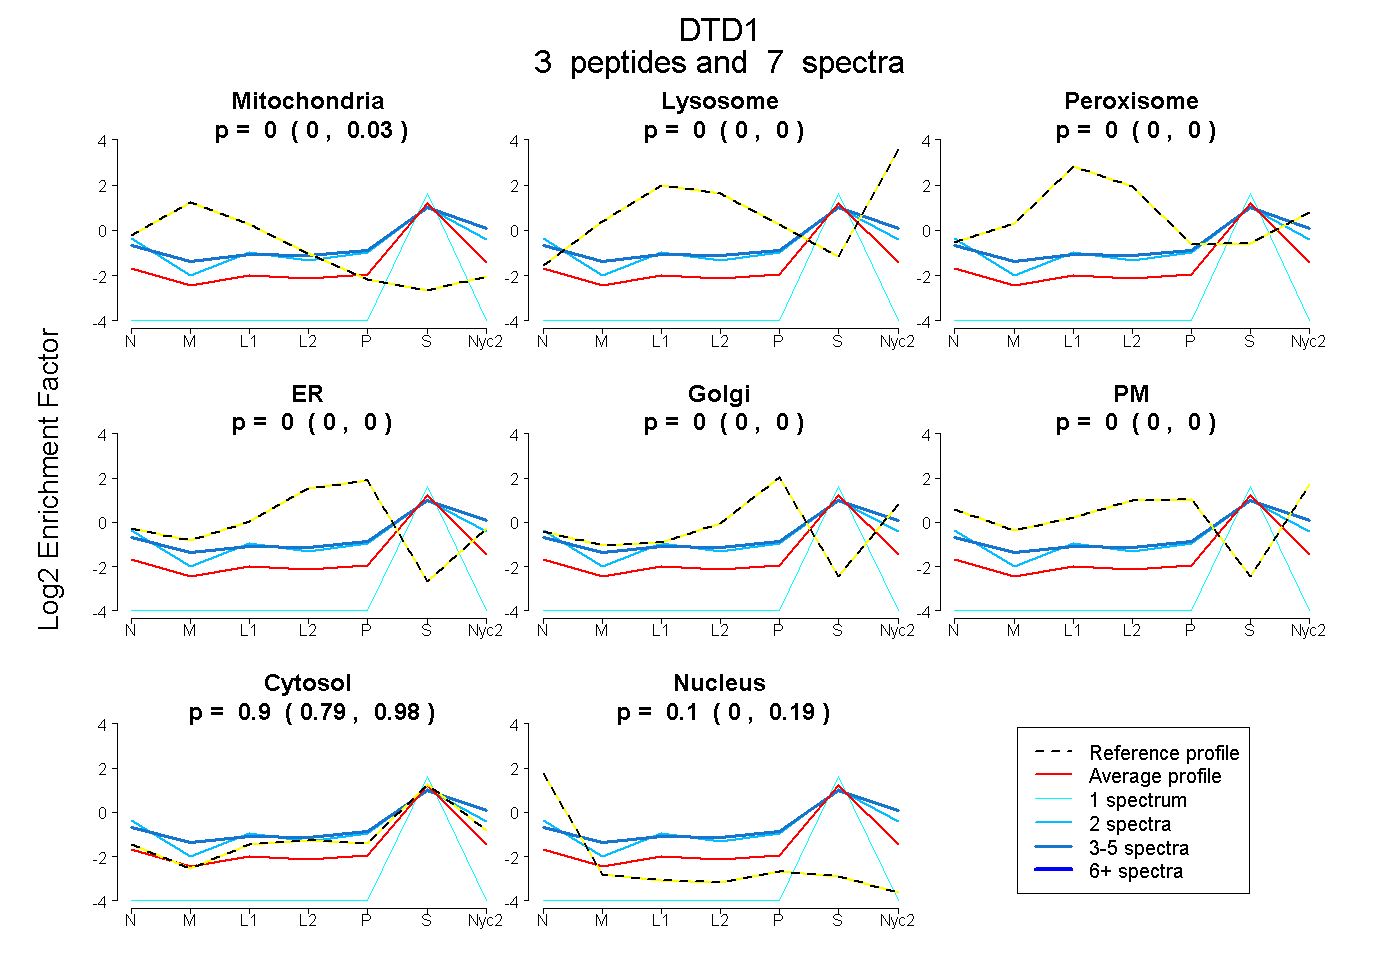
0.000 | 0.032
0.000 | 0.000
0.000 | 0.000
0.000 | 0.000
0.000 | 0.000
0.000 | 0.000
0.792 | 0.980
0.000 | 0.189
2peptides
spectra
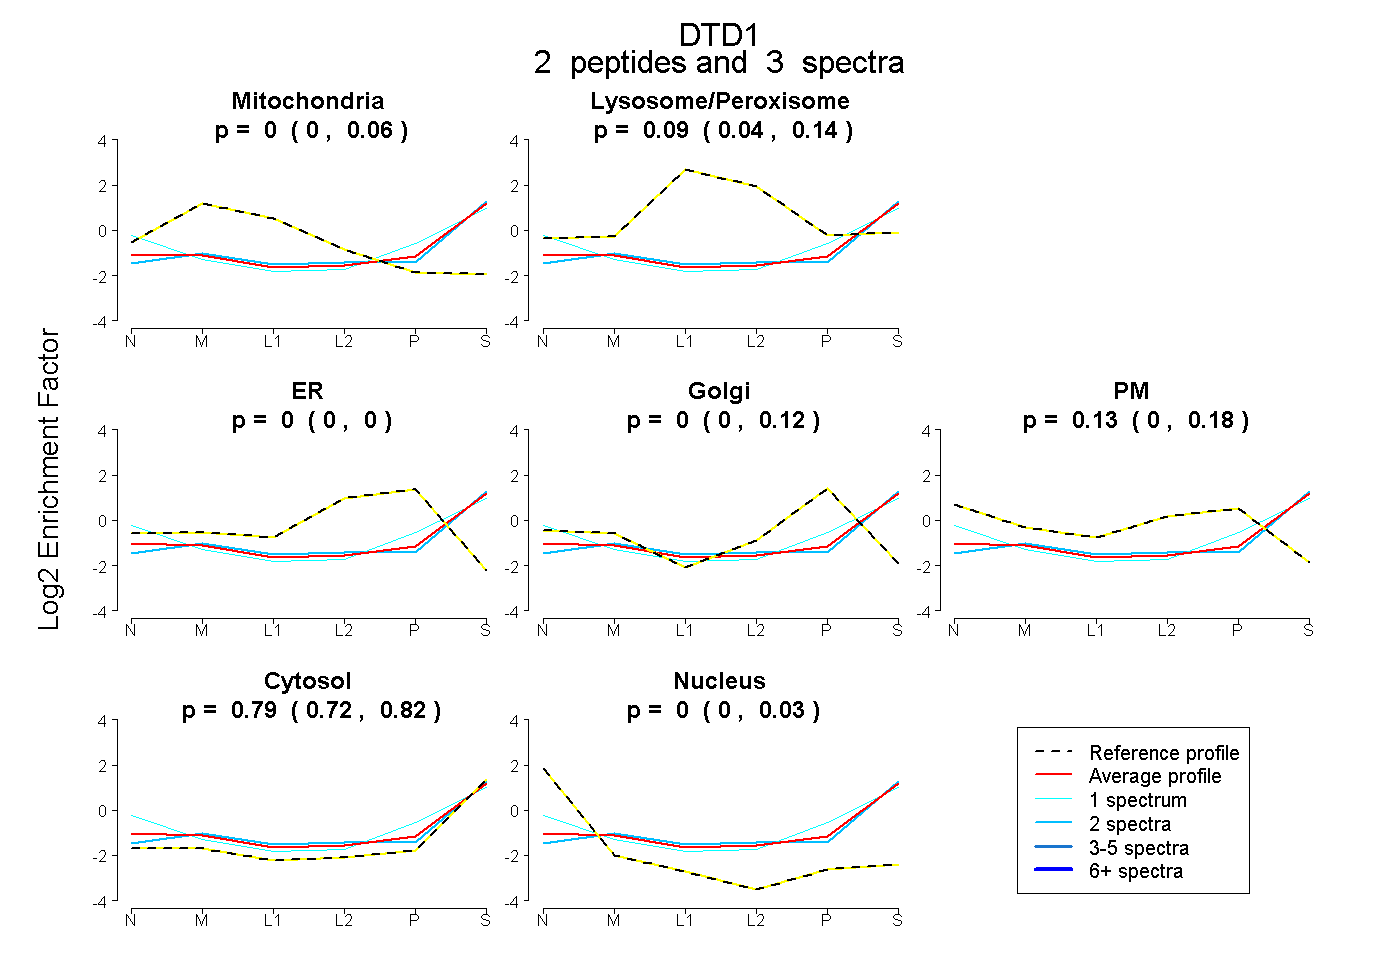
0.000 | 0.056
0.037 | 0.143
0.000 | 0.000
0.000 | 0.118
0.000 | 0.184
0.723 | 0.820
0.000 | 0.030
5peptides
spectra
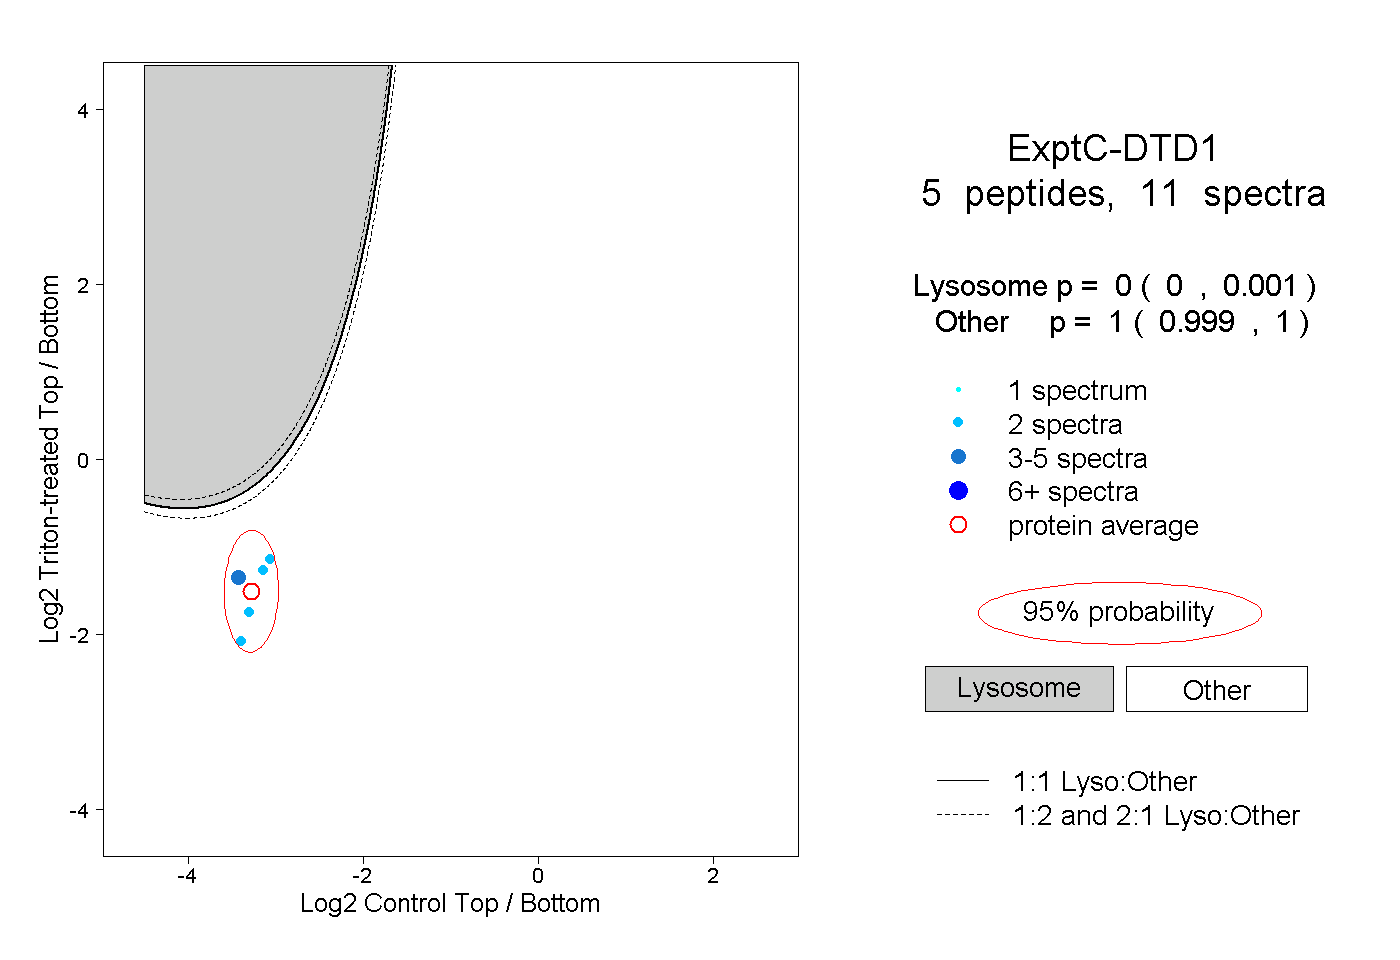
0.000 | 0.001
0.999 | 1.000