 4
4peptides
spectra
0.000 | 0.000
0.092 | 0.214
0.000 | 0.103
0.000 | 0.065
0.000 | 0.000
0.724 | 0.843
0.000 | 0.001
0.000 | 0.000
5peptides
spectra
0.064 | 1.000
0.000 | 0.933
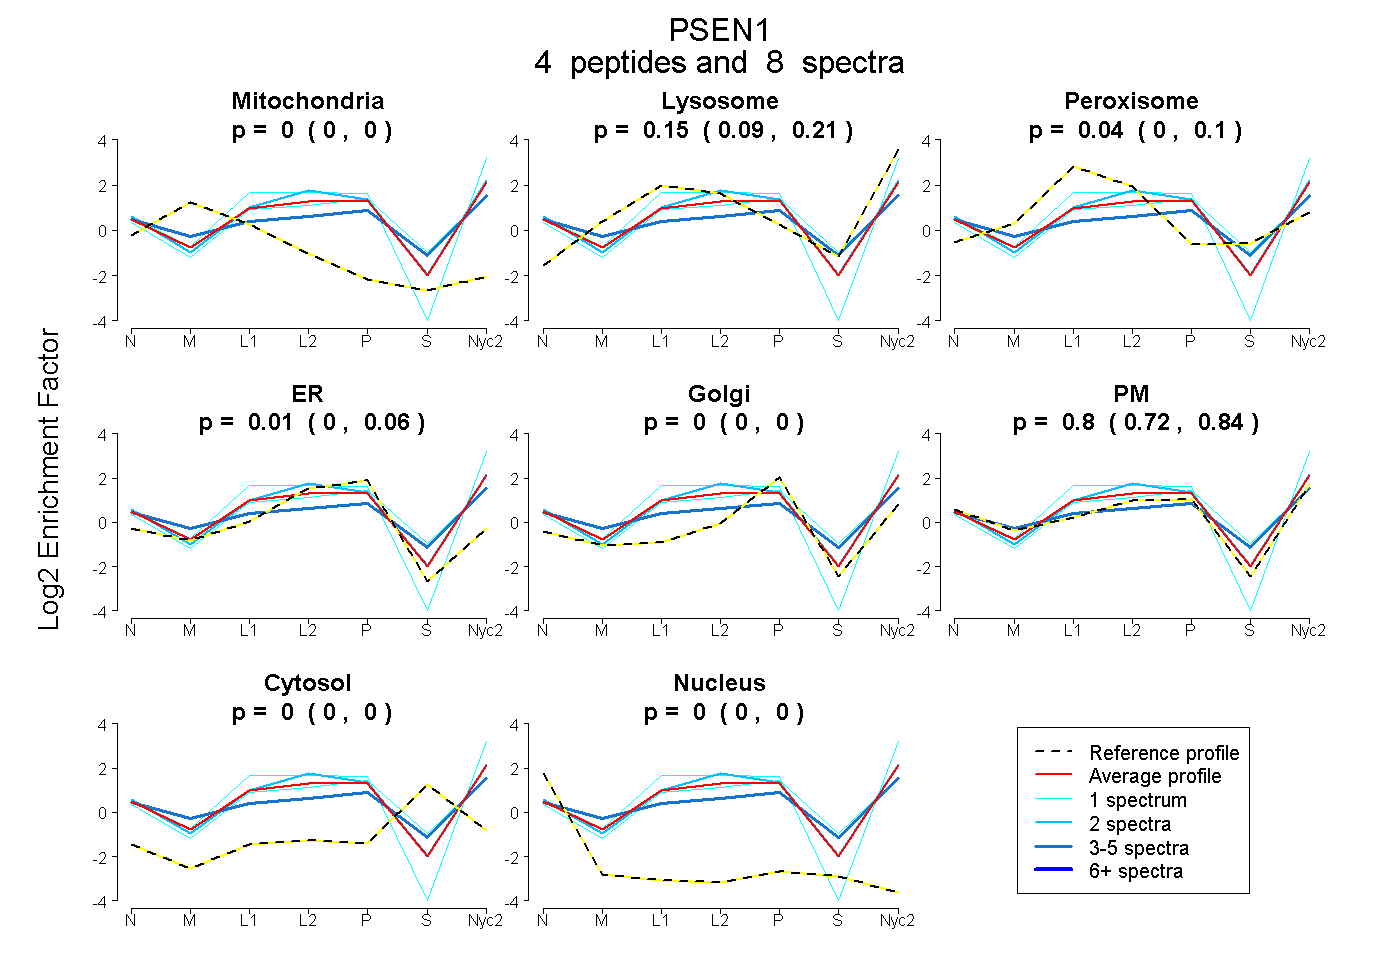
| Plot | Mito | Lyso | Perox | ER | Golgi | PM | Cytosol | Nucleus | |||||
| Expt A |
4 peptides |
8 spectra |
|
0.000 0.000 | 0.000 |
0.154 0.092 | 0.214 |
0.037 0.000 | 0.103 |
0.007 0.000 | 0.065 |
0.000 0.000 | 0.000 |
0.801 0.724 | 0.843 |
0.000 0.000 | 0.001 |
0.000 0.000 | 0.000 |
||
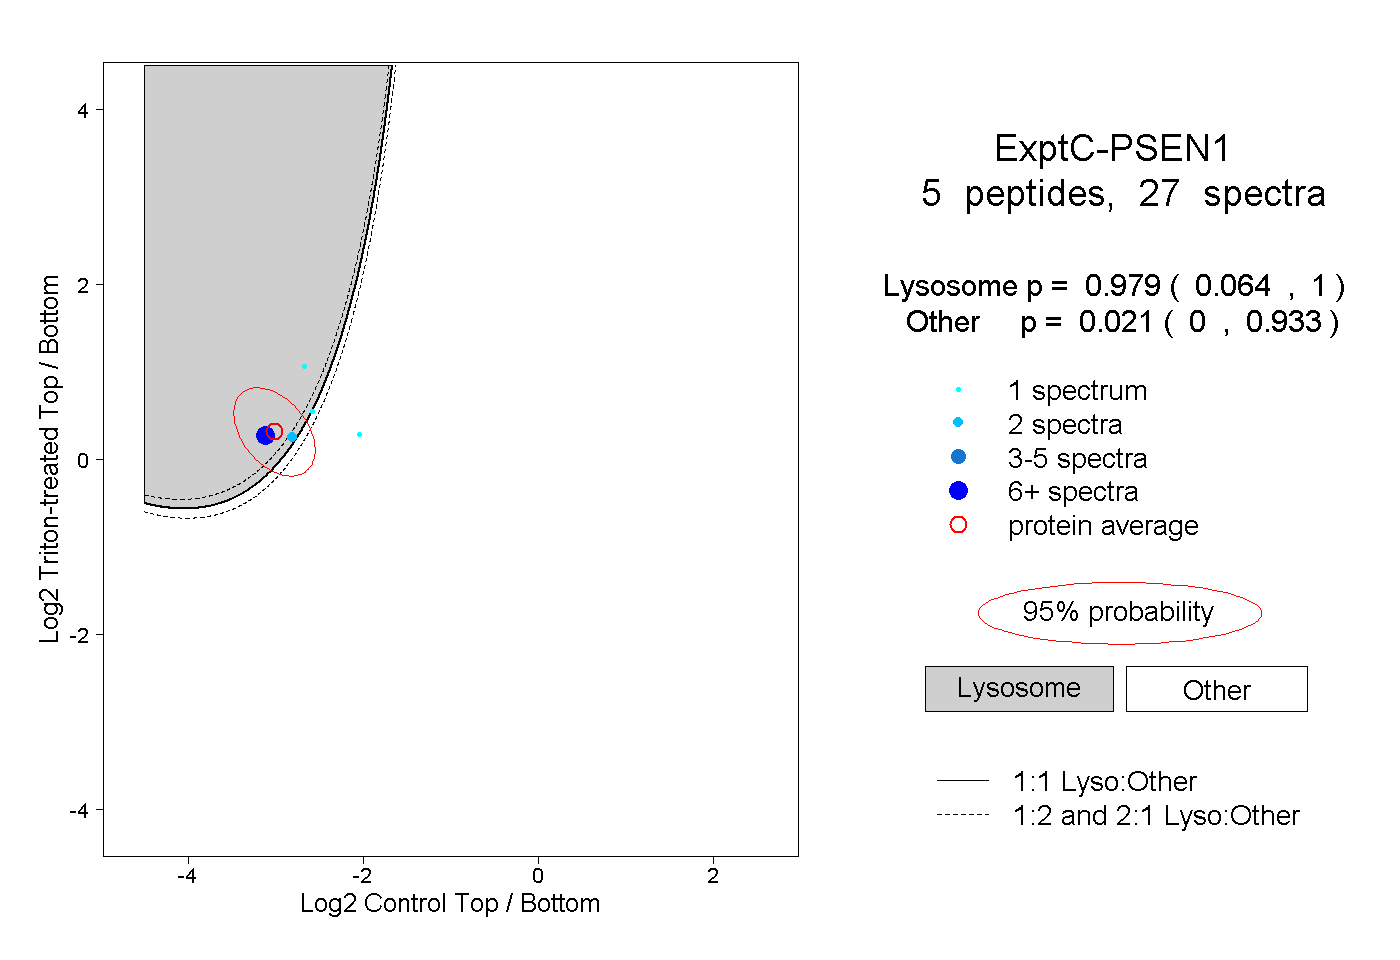
| Plot | Lyso | Other | |||||||||||
| Expt C |
5 peptides |
27 spectra |
|
0.979 0.064 | 1.000 |
0.021 0.000 | 0.933 |
| 22 spectra, MLVETAQER | 0.990 | 0.010 | ||||||||
| 2 spectra, SVSFYTR | 0.655 | 0.345 | ||||||||
| 1 spectrum, DGQLIYTPFTEDTETVGQR | 0.996 | 0.004 | ||||||||
| 1 spectrum, YSTQGTER | 0.000 | 1.000 | ||||||||
| 1 spectrum, LDNPESISNGRPQSNFTR | 0.454 | 0.546 |