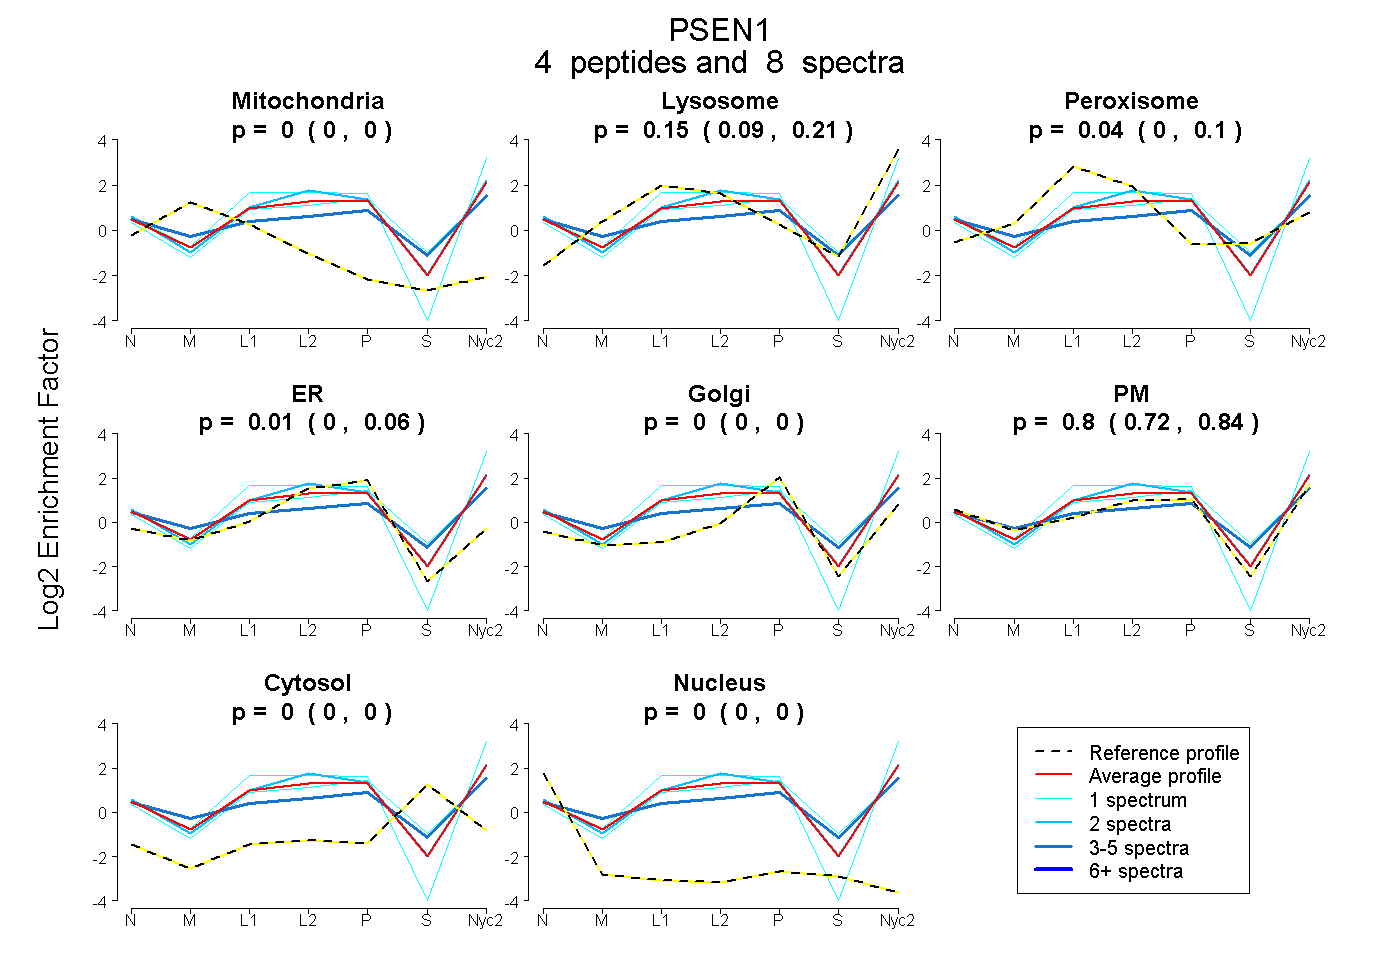
 4
4peptides
spectra
0.000 | 0.000
0.092 | 0.214
0.000 | 0.103
0.000 | 0.065
0.000 | 0.000
0.724 | 0.843
0.000 | 0.001
0.000 | 0.000
| Plot | Mito | Lyso | Perox | ER | Golgi | PM | Cytosol | Nucleus | |||||
| Expt A |
4 peptides |
8 spectra |
|
0.000 0.000 | 0.000 |
0.154 0.092 | 0.214 |
0.037 0.000 | 0.103 |
0.007 0.000 | 0.065 |
0.000 0.000 | 0.000 |
0.801 0.724 | 0.843 |
0.000 0.000 | 0.001 |
0.000 0.000 | 0.000 |
| 1 spectrum, AAVQELSGSILTSEDPEER | 0.000 | 0.217 | 0.000 | 0.000 | 0.000 | 0.783 | 0.000 | 0.000 | ||
| 4 spectra, YSTQGTER | 0.000 | 0.070 | 0.100 | 0.000 | 0.000 | 0.702 | 0.128 | 0.000 | ||
| 1 spectrum, DSHLGPHR | 0.000 | 0.087 | 0.188 | 0.017 | 0.153 | 0.481 | 0.073 | 0.000 | ||
| 2 spectra, LDNPESISNGRPQSNFTR | 0.000 | 0.169 | 0.038 | 0.040 | 0.000 | 0.754 | 0.000 | 0.000 |
| Plot | Lyso | Other | |||||||||||
| Expt C |
5 peptides |
27 spectra |
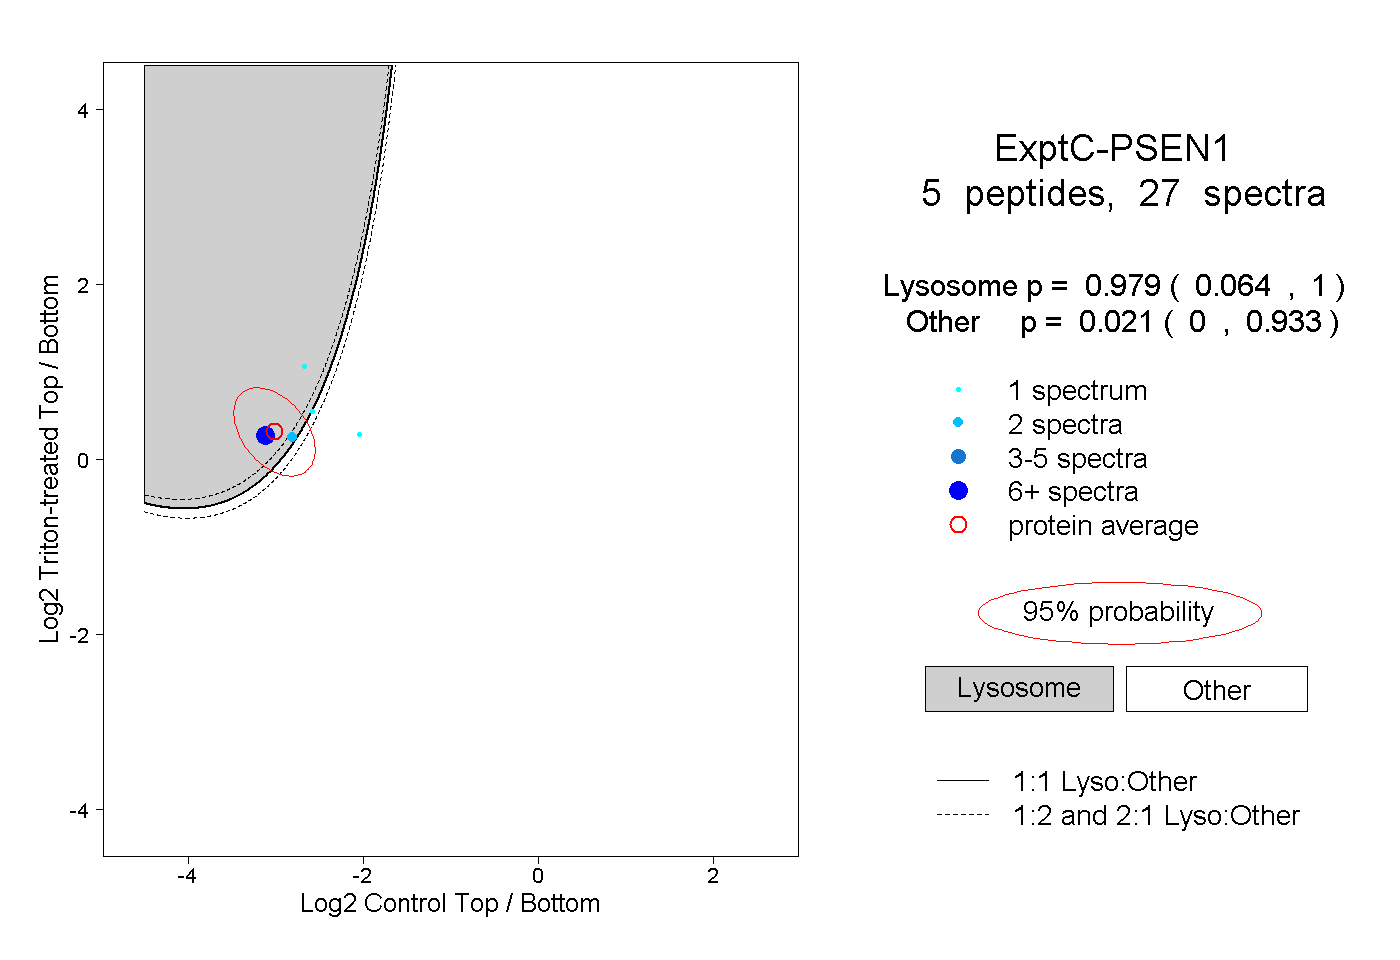 |
0.979 0.064 | 1.000 |
0.021 0.000 | 0.933 |