 2
2peptides
spectra
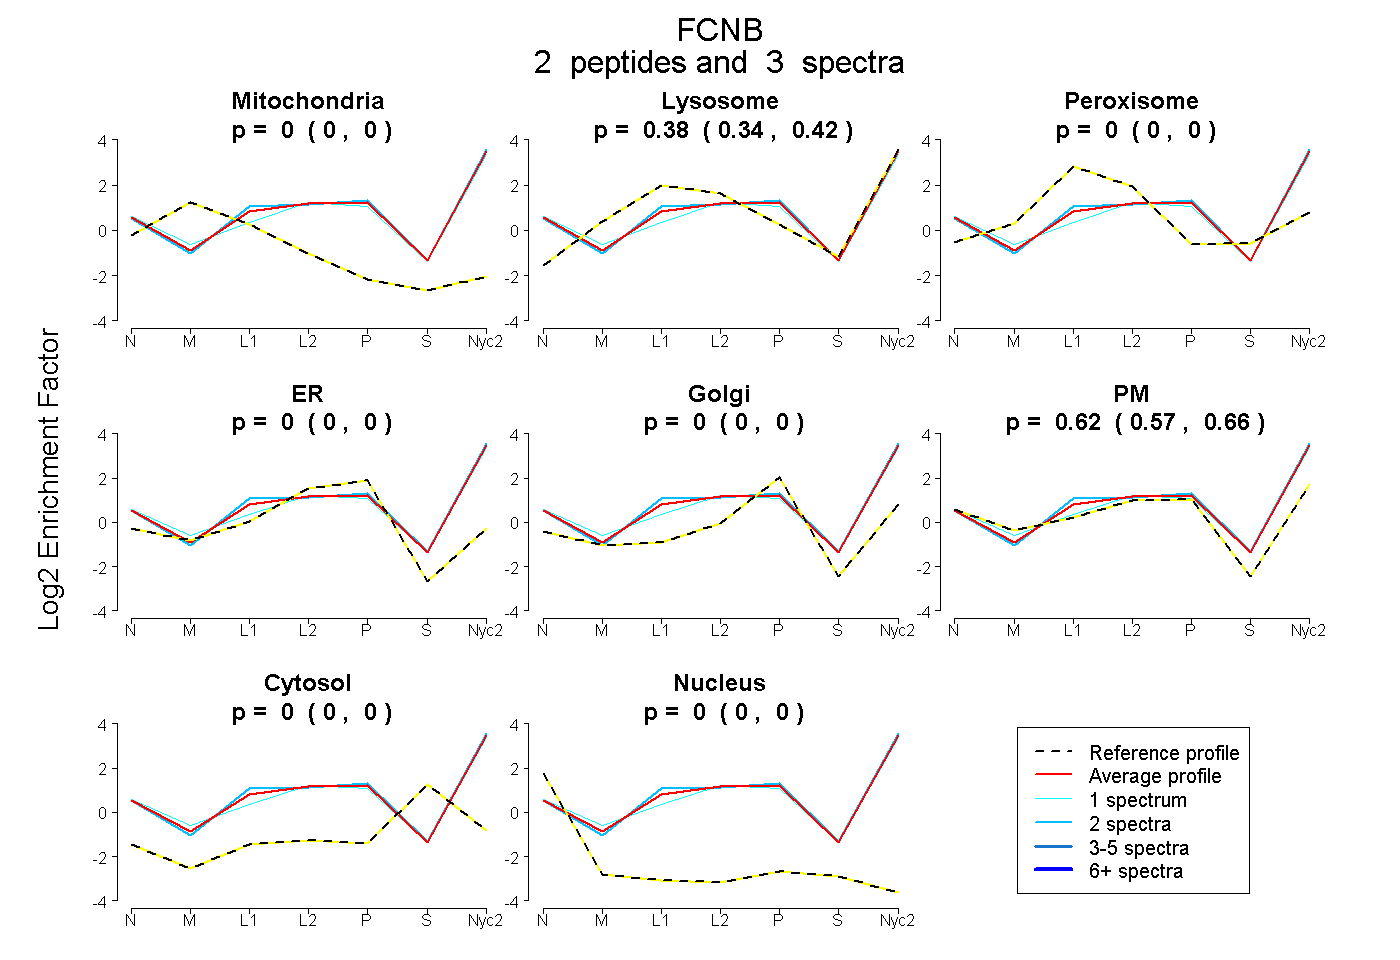
0.000 | 0.000
0.336 | 0.423
0.000 | 0.000
0.000 | 0.000
0.000 | 0.000
0.571 | 0.655
0.000 | 0.000
0.000 | 0.000
| Plot | Mito | Lyso | Perox | ER | Golgi | PM | Cytosol | Nucleus | |||||
| Expt A |
2 peptides |
3 spectra |
|
0.000 0.000 | 0.000 |
0.382 0.336 | 0.423 |
0.000 0.000 | 0.000 |
0.000 0.000 | 0.000 |
0.000 0.000 | 0.000 |
0.618 0.571 | 0.655 |
0.000 0.000 | 0.000 |
0.000 0.000 | 0.000 |
| 1 spectrum, IDGTVDFFR | 0.000 | 0.324 | 0.000 | 0.000 | 0.000 | 0.676 | 0.000 | 0.000 | ||
| 2 spectra, VDLADFDGNHDFAK | 0.000 | 0.411 | 0.000 | 0.000 | 0.000 | 0.589 | 0.000 | 0.000 |
| Plot | Lyso | Other | |||||||||||
| Expt C |
1 peptide |
2 spectra |
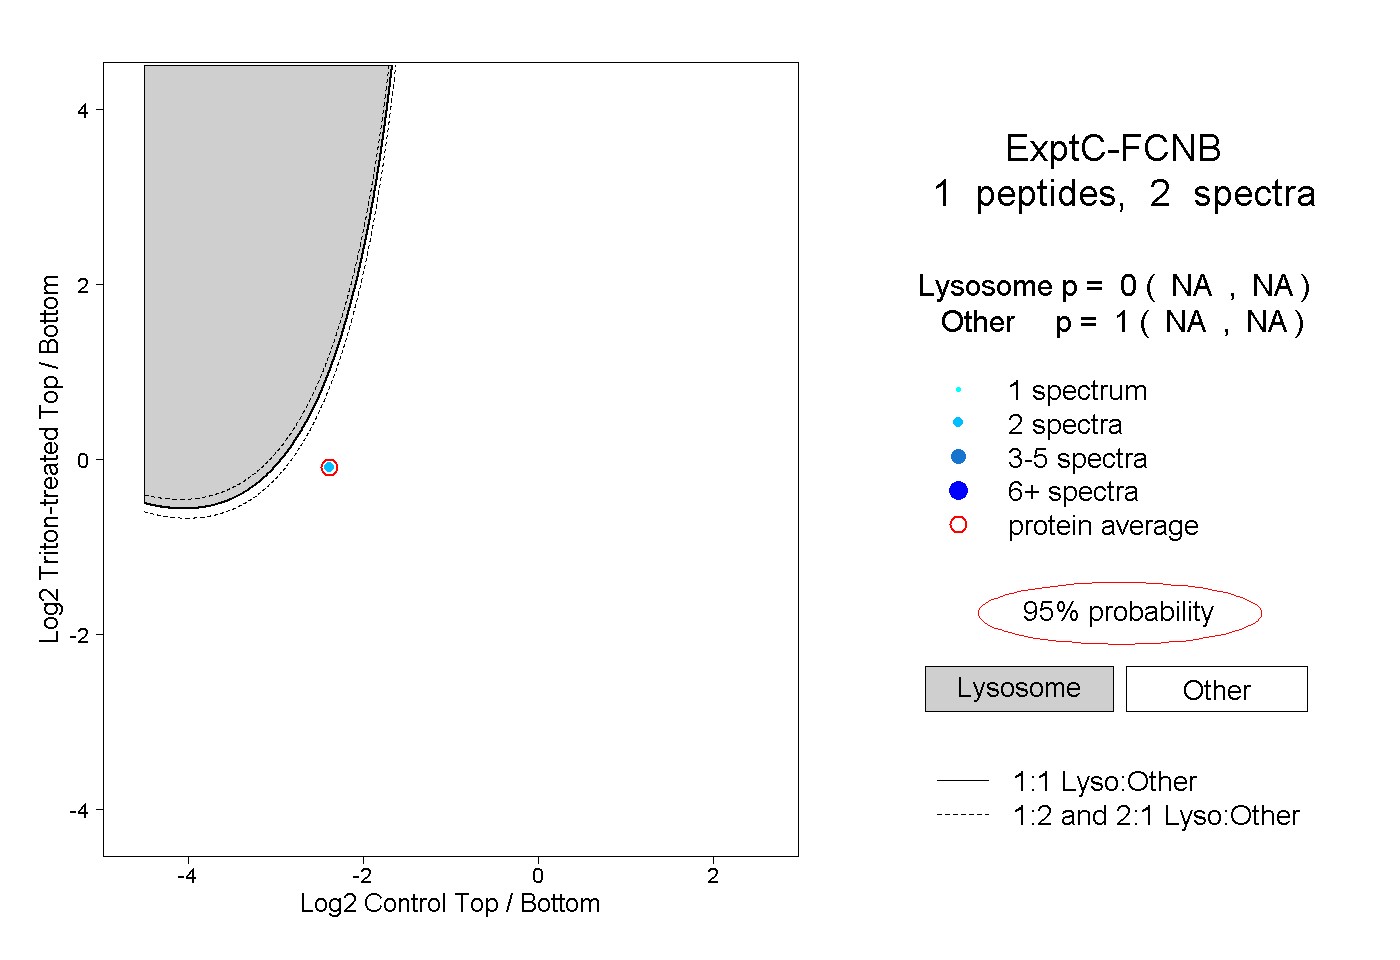 |
0.000 NA | NA |
1.000 NA | NA |