 23
23peptides
spectra
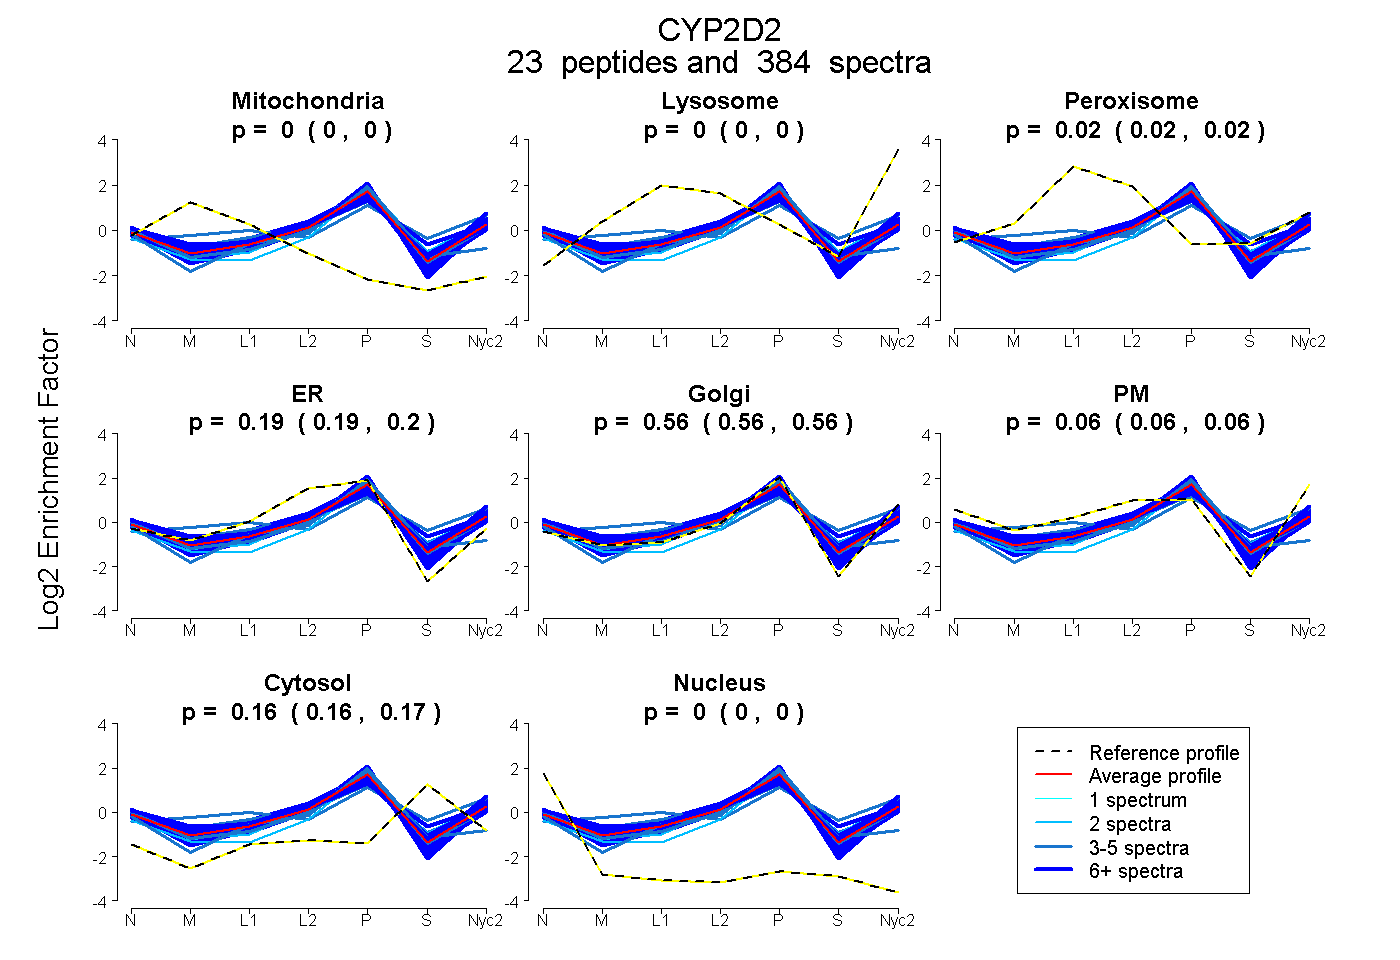
0.000 | 0.000
0.000 | 0.000
0.019 | 0.022
0.191 | 0.195
0.556 | 0.564
0.059 | 0.064
0.163 | 0.165
0.000 | 0.000
23peptides
spectra
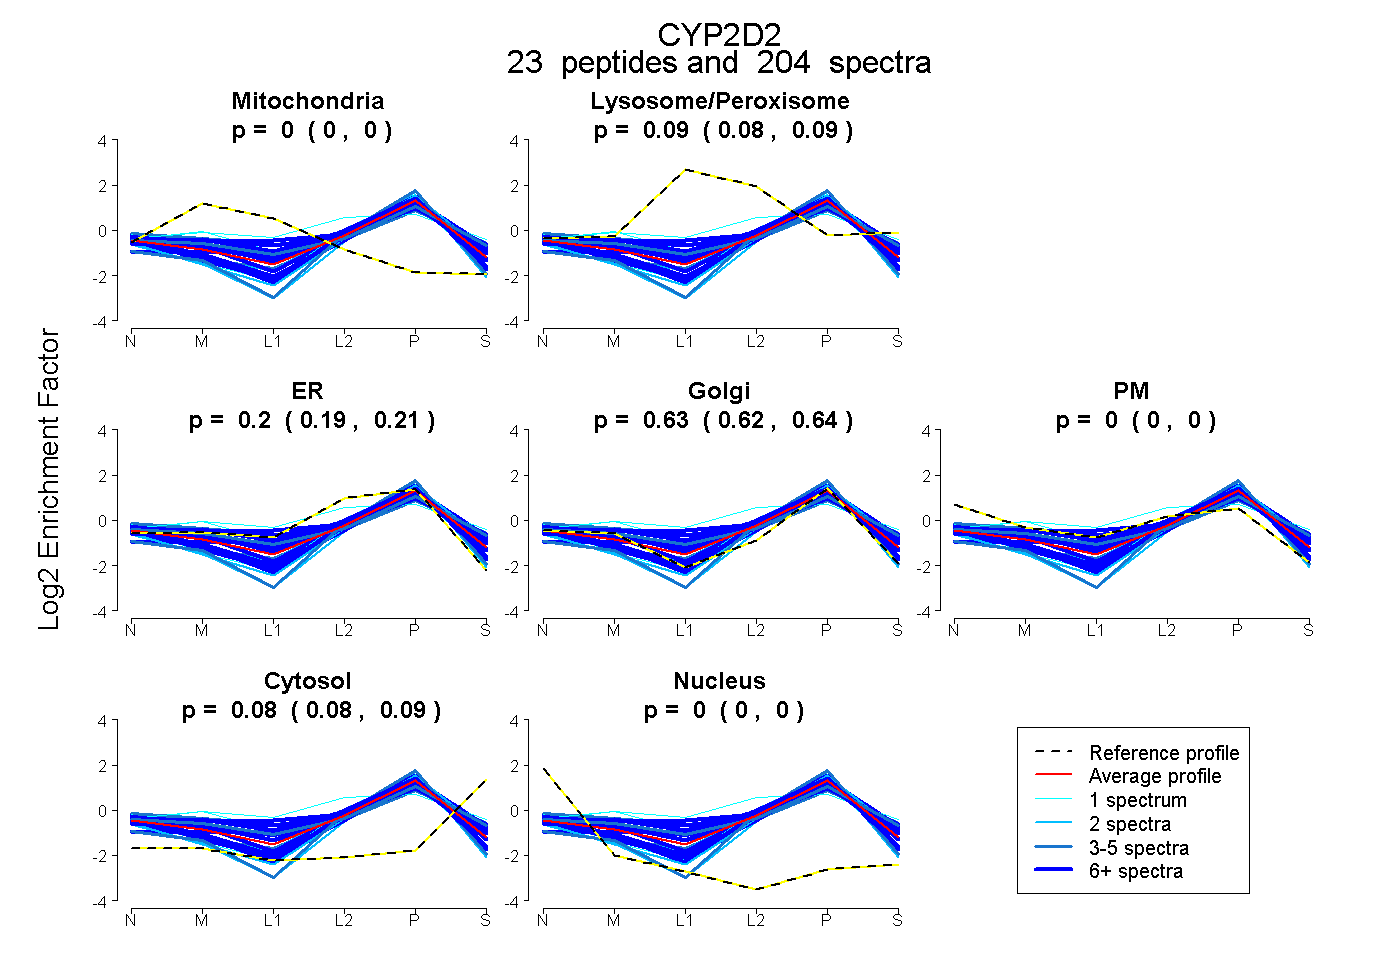
0.000 | 0.000
0.082 | 0.093
0.186 | 0.205
0.625 | 0.639
0.000 | 0.000
0.080 | 0.086
0.000 | 0.000
23peptides
spectra
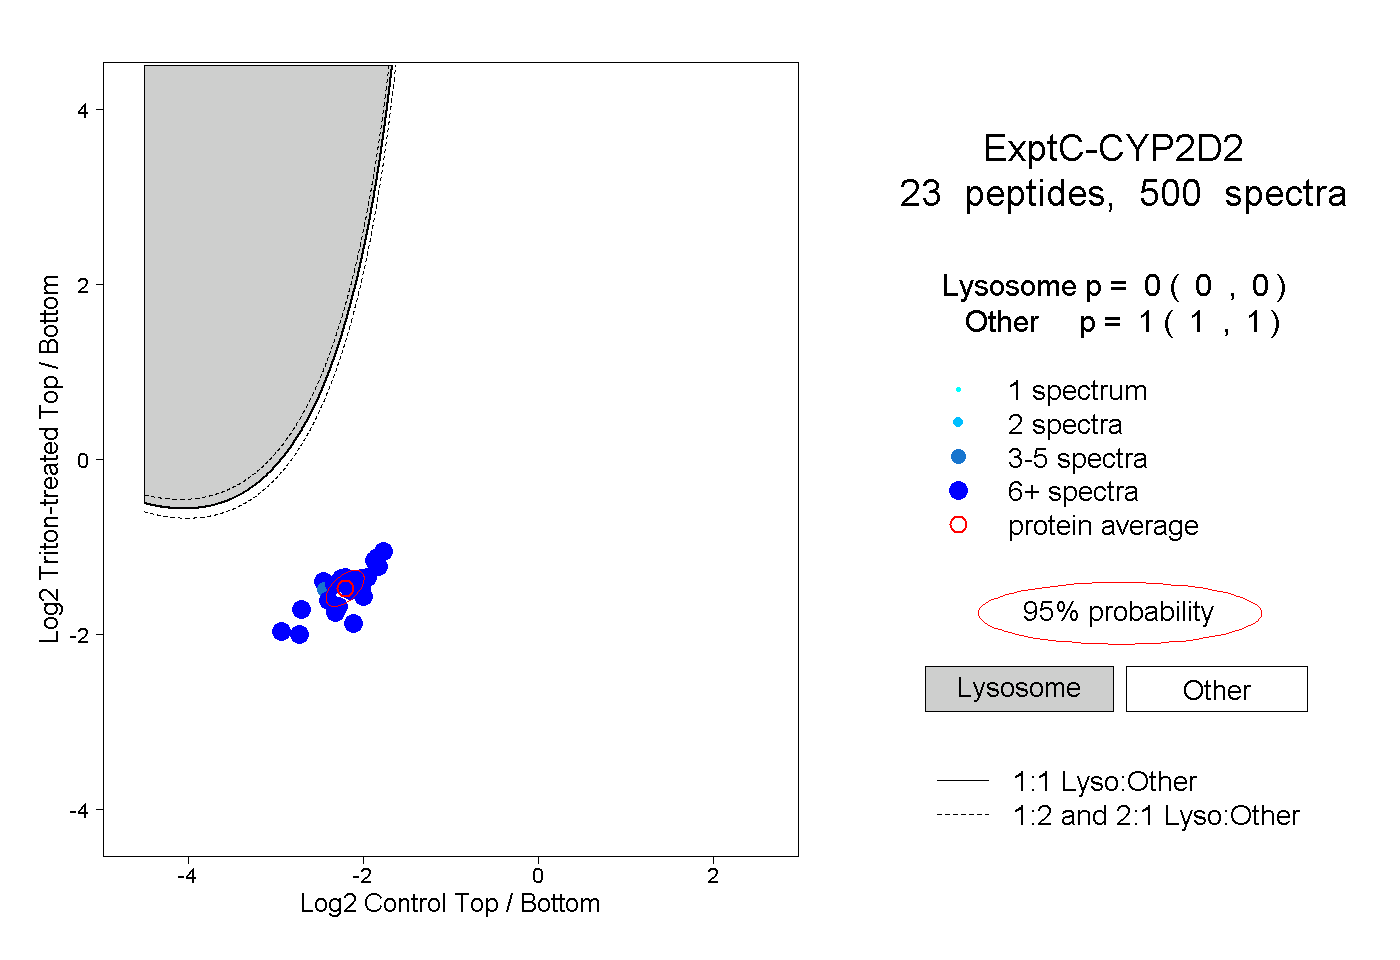
0.000 | 0.000
1.000 | 1.000
13peptides
spectra
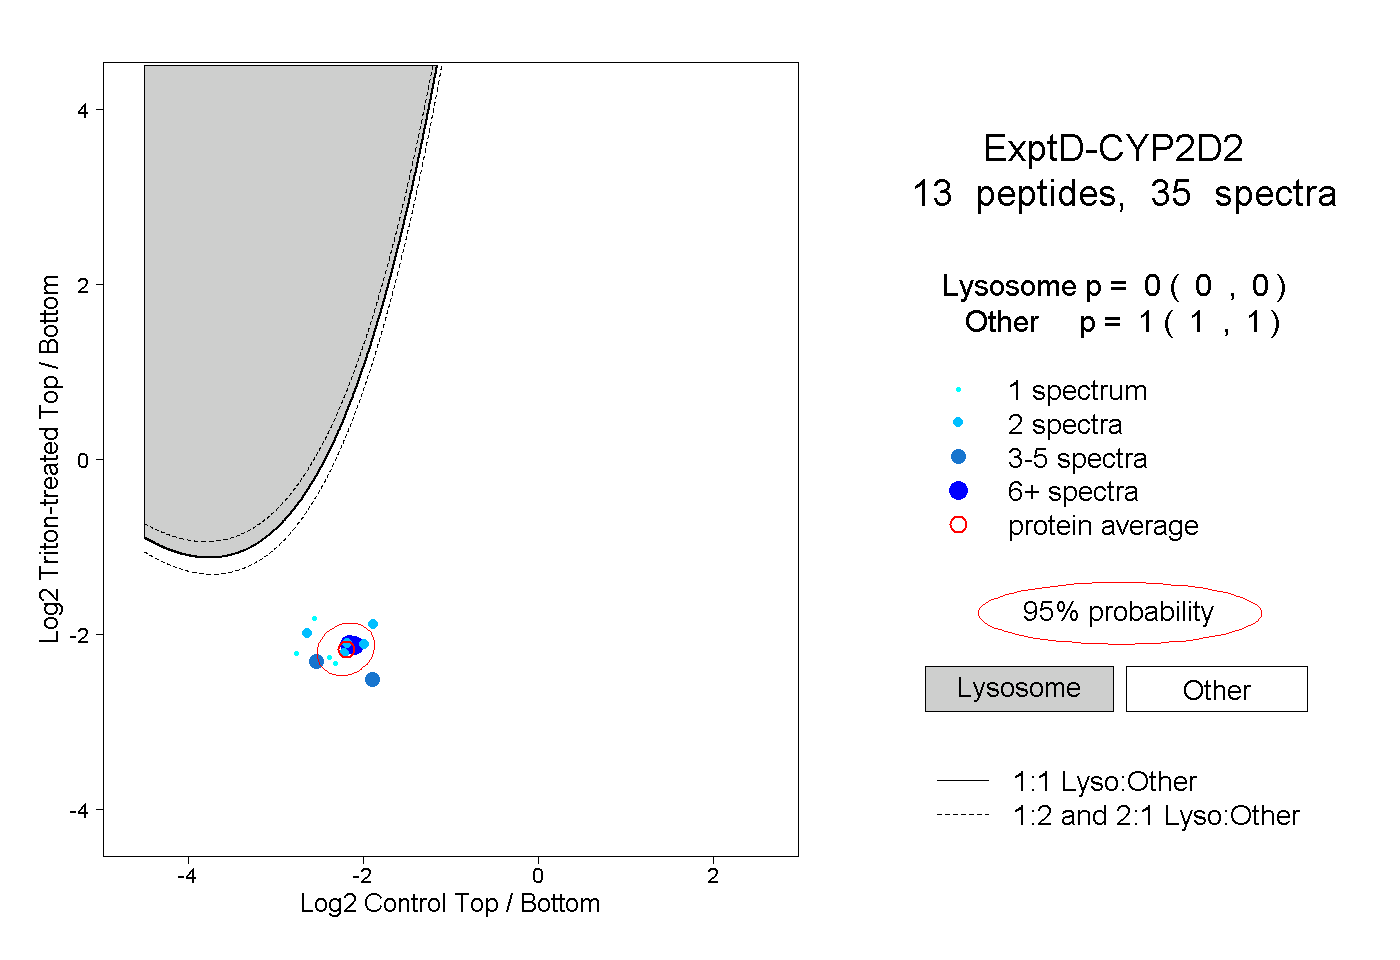
0.000 | 0.000
1.000 | 1.000