 4
4peptides
spectra
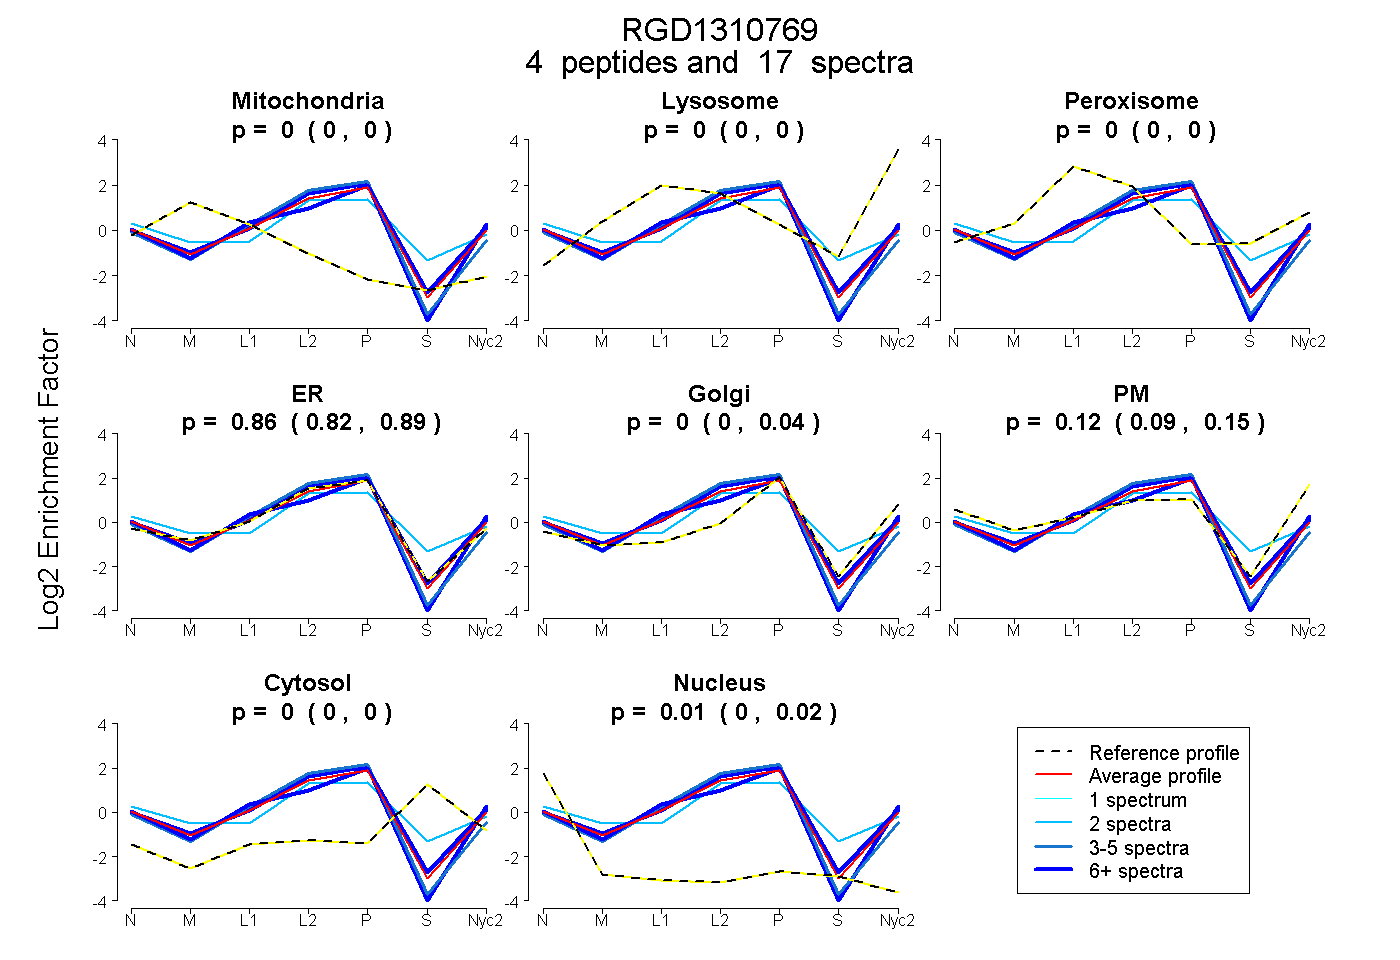
0.000 | 0.000
0.000 | 0.000
0.000 | 0.000
0.821 | 0.889
0.000 | 0.040
0.088 | 0.147
0.000 | 0.000
0.001 | 0.019
4peptides
spectra
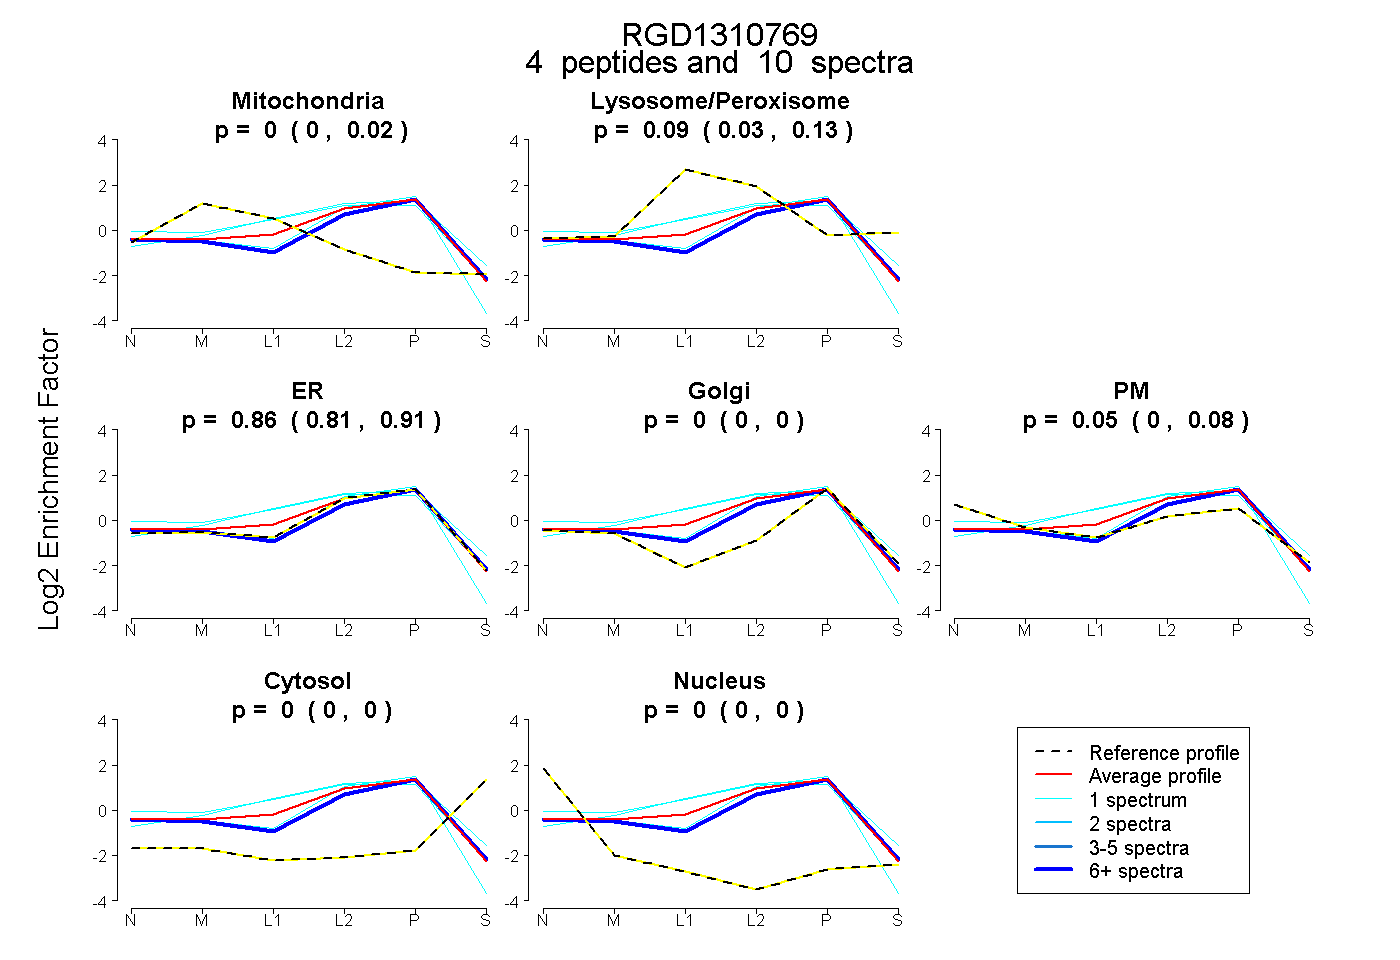
0.000 | 0.022
0.034 | 0.133
0.808 | 0.914
0.000 | 0.000
0.000 | 0.085
0.000 | 0.000
0.000 | 0.000
4peptides
spectra
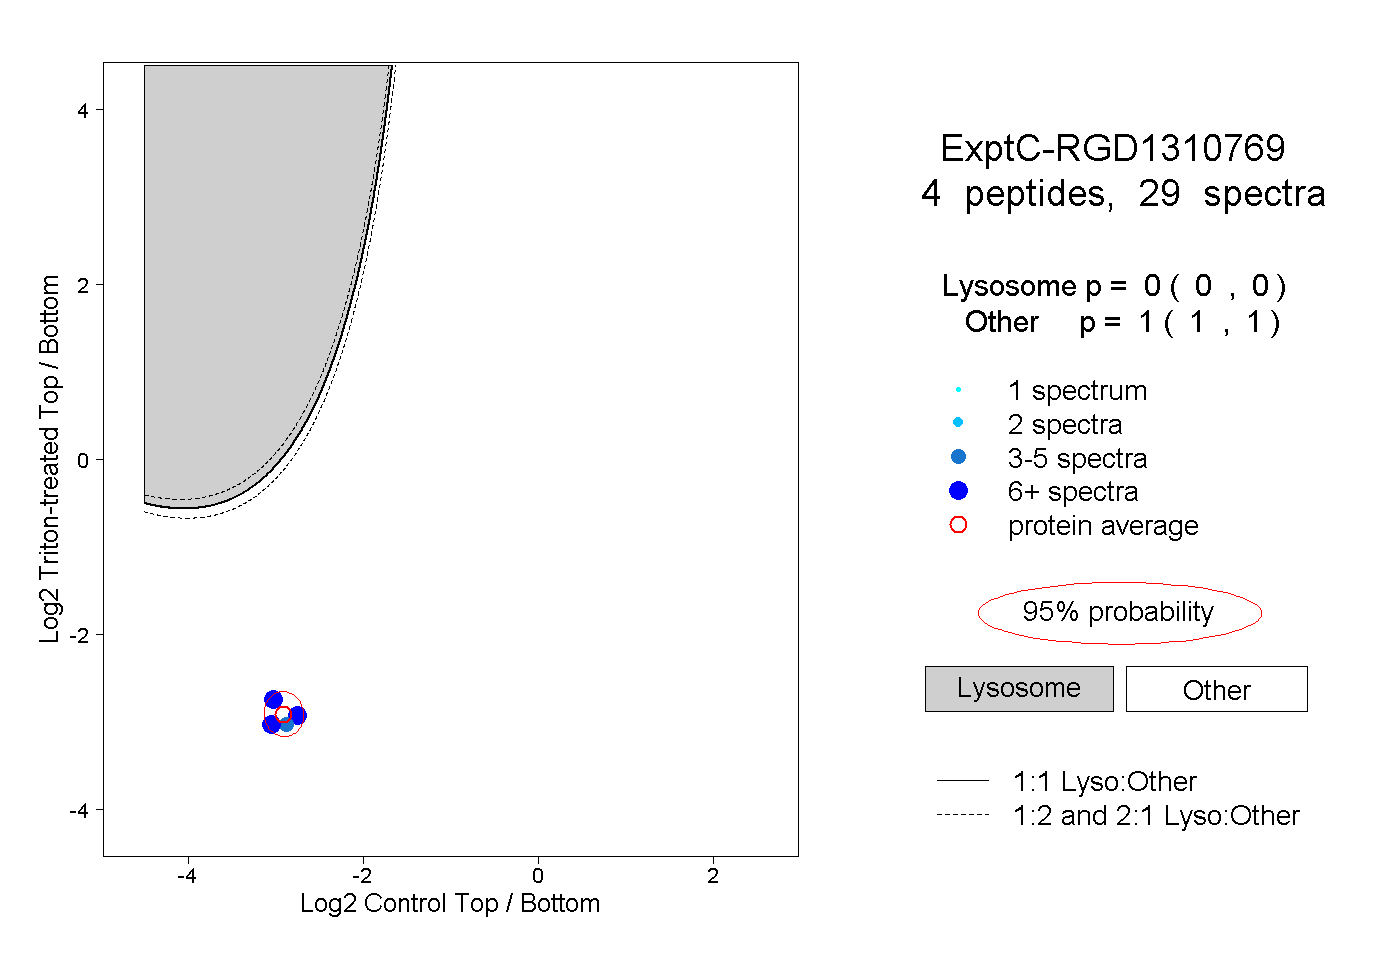
0.000 | 0.000
1.000 | 1.000
1peptide
spectra
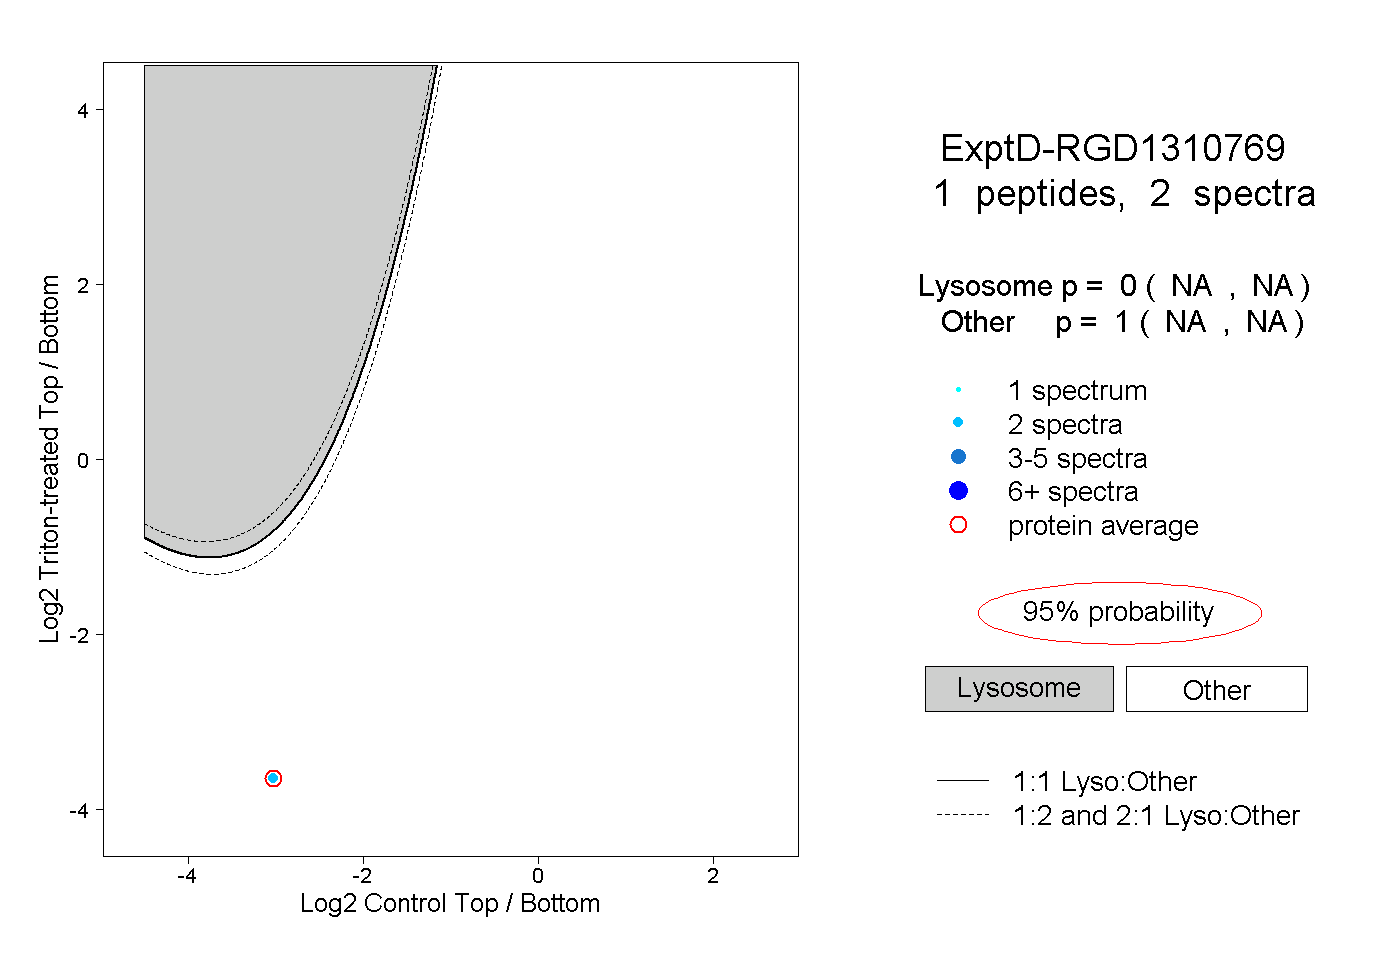
NA | NA
NA | NA