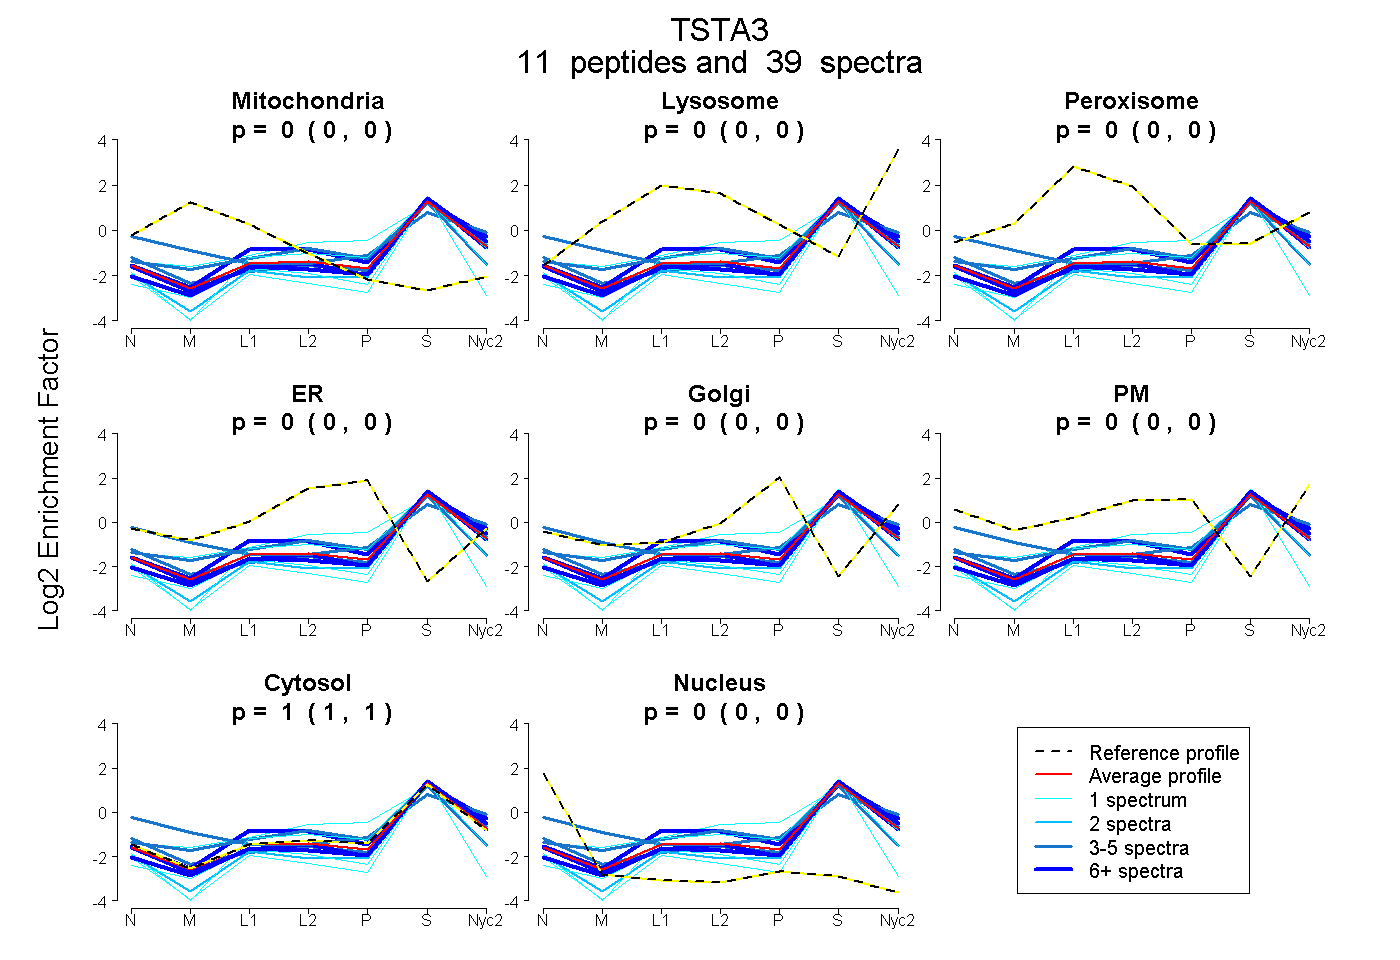
 11
11peptides
spectra
0.000 | 0.000
0.000 | 0.000
0.000 | 0.000
0.000 | 0.000
0.000 | 0.000
0.000 | 0.000
0.999 | 1.000
0.000 | 0.000
| Plot | Mito | Lyso | Perox | ER | Golgi | PM | Cytosol | Nucleus | |||||
| Expt A |
11 peptides |
39 spectra |
|
0.000 0.000 | 0.000 |
0.000 0.000 | 0.000 |
0.000 0.000 | 0.000 |
0.000 0.000 | 0.000 |
0.000 0.000 | 0.000 |
0.000 0.000 | 0.000 |
1.000 0.999 | 1.000 |
0.000 0.000 | 0.000 |
| 3 spectra, SDGQYK | 0.124 | 0.000 | 0.000 | 0.000 | 0.000 | 0.161 | 0.715 | 0.000 | ||
| 3 spectra, ETCAWFTENYEQAR | 0.000 | 0.000 | 0.000 | 0.000 | 0.000 | 0.000 | 0.900 | 0.100 | ||
| 1 spectrum, SSGSALTVWGTGKPR | 0.000 | 0.000 | 0.000 | 0.000 | 0.000 | 0.000 | 1.000 | 0.000 | ||
| 6 spectra, YNLDFWR | 0.000 | 0.000 | 0.000 | 0.000 | 0.000 | 0.000 | 1.000 | 0.000 | ||
| 10 spectra, ILVTGGSGLVGR | 0.000 | 0.000 | 0.000 | 0.000 | 0.000 | 0.000 | 0.991 | 0.009 | ||
| 2 spectra, QFIYSLDLAR | 0.000 | 0.000 | 0.000 | 0.000 | 0.000 | 0.000 | 1.000 | 0.000 | ||
| 4 spectra, NVHINDNVLHSAFEVGTR | 0.032 | 0.047 | 0.056 | 0.000 | 0.000 | 0.000 | 0.865 | 0.000 | ||
| 1 spectrum, DADLTDAAQTQALFQK | 0.000 | 0.116 | 0.000 | 0.098 | 0.000 | 0.000 | 0.786 | 0.000 | ||
| 1 spectrum, SYLPDFCFTPFK | 0.000 | 0.000 | 0.000 | 0.000 | 0.000 | 0.000 | 0.821 | 0.179 | ||
| 7 spectra, MIDVQNR | 0.000 | 0.079 | 0.025 | 0.000 | 0.000 | 0.000 | 0.896 | 0.000 | ||
| 1 spectrum, VVADGAGLPGEEWVFVSSK | 0.000 | 0.000 | 0.000 | 0.000 | 0.000 | 0.000 | 1.000 | 0.000 |
| Plot | Mito | Lyso or Perox | ER | Golgi | PM | Cytosol | Nucleus | ||||||
| Expt B |
7 peptides |
18 spectra |
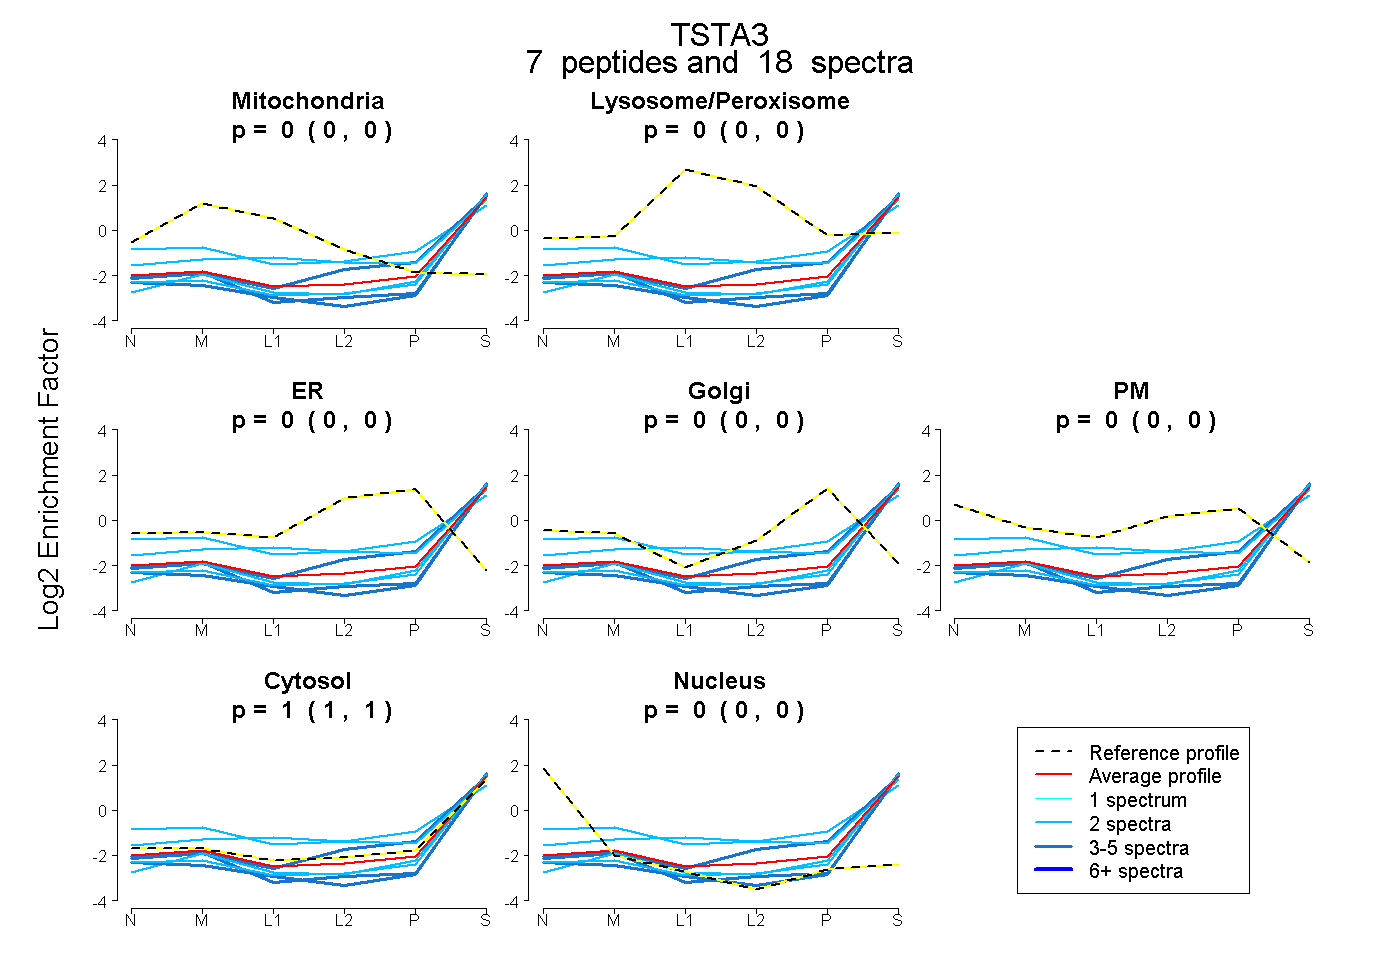 |
0.000 0.000 | 0.000 |
0.000 0.000 | 0.000 |
0.000 0.000 | 0.000 |
0.000 0.000 | 0.000 |
0.000 0.000 | 0.000 |
1.000 1.000 | 1.000 |
0.000 0.000 | 0.000 |
|||
| Plot | Lyso | Other | |||||||||||
| Expt C |
7 peptides |
21 spectra |
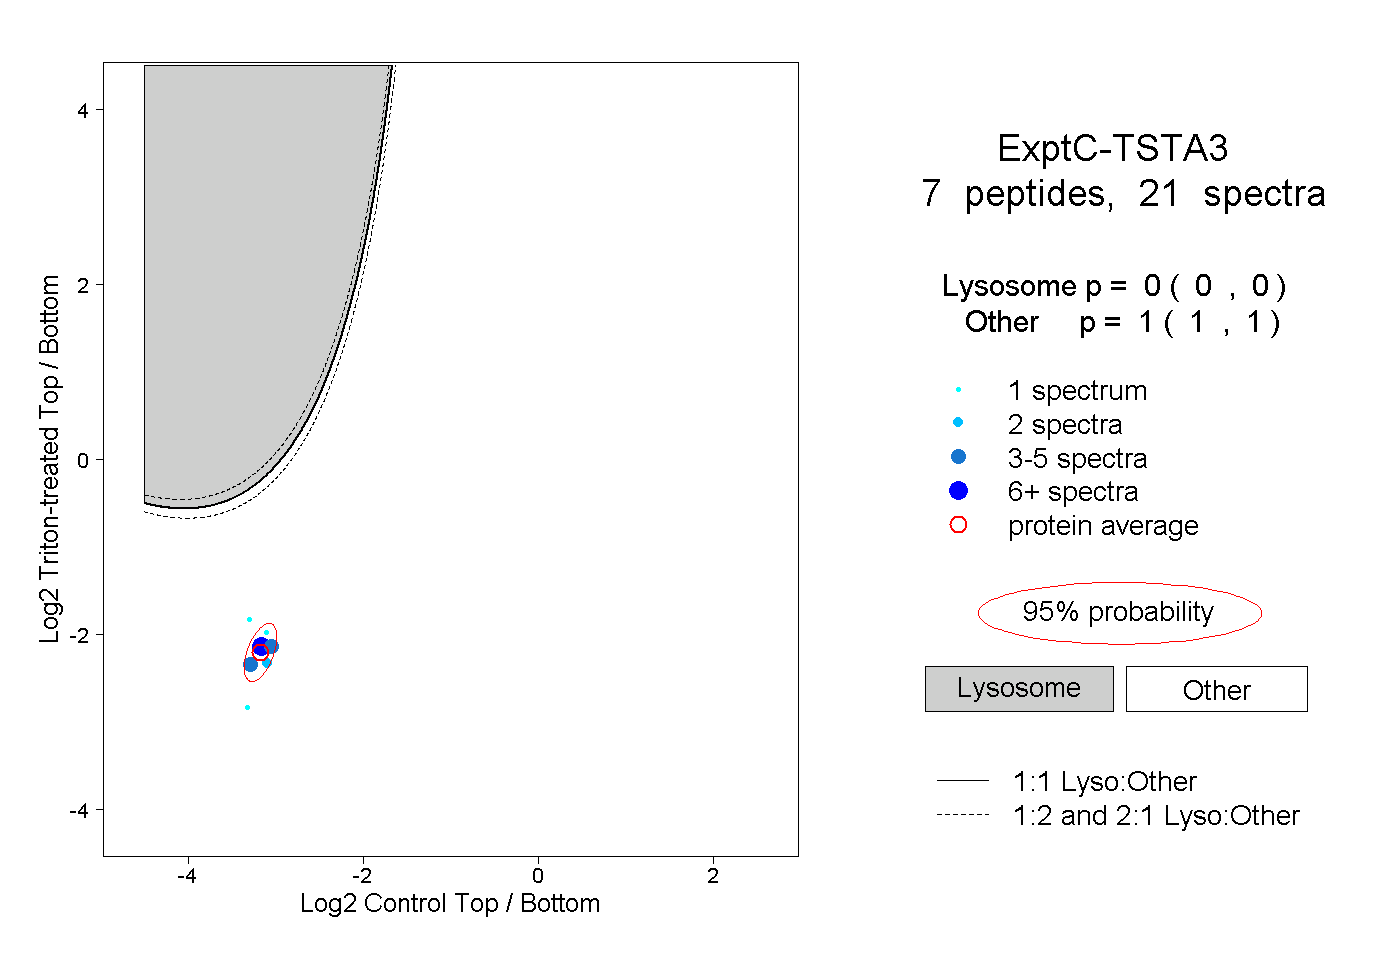 |
0.000 0.000 | 0.000 |
1.000 1.000 | 1.000 |
||||||||
| Plot | Lyso | Other | |||||||||||
| Expt D |
2 peptides |
4 spectra |
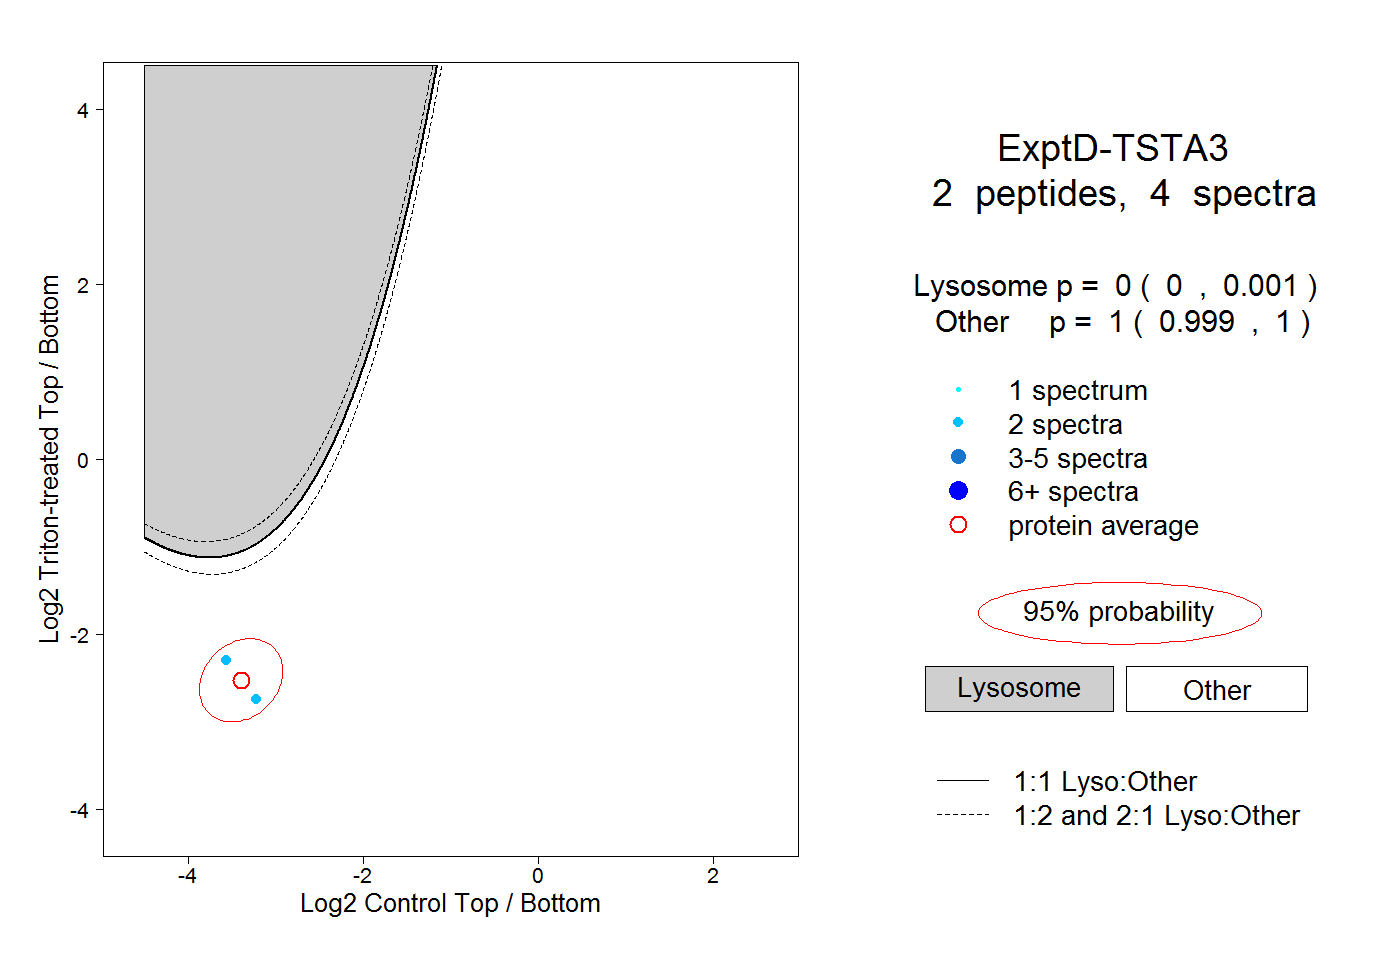 |
0.000 0.000 | 0.001 |
1.000 0.999 | 1.000 |