 6
6peptides
spectra
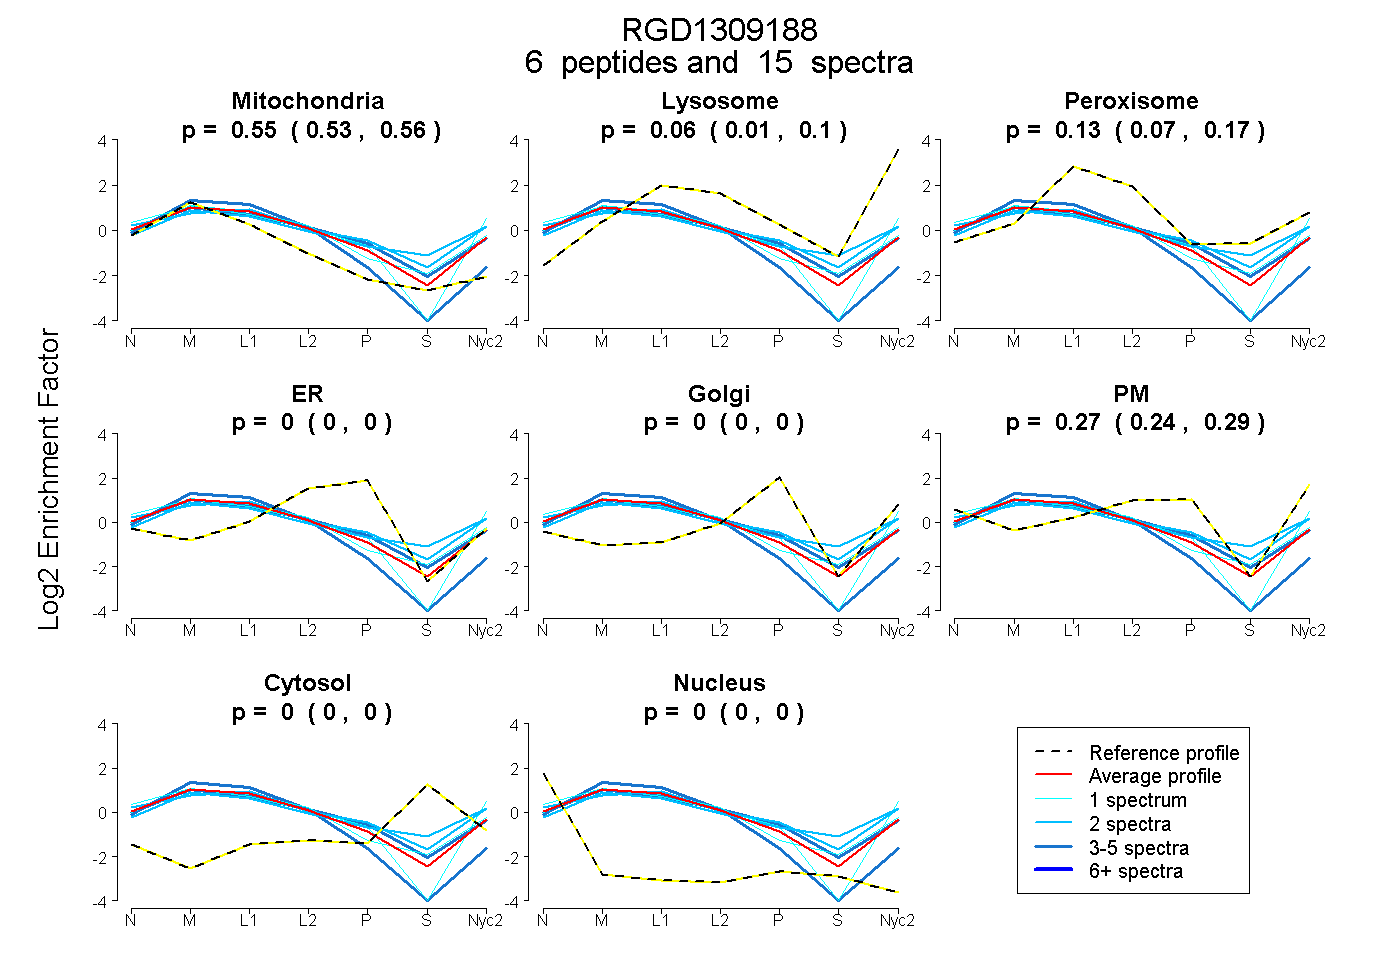
0.527 | 0.563
0.006 | 0.099
0.070 | 0.174
0.000 | 0.000
0.000 | 0.000
0.237 | 0.291
0.000 | 0.000
0.000 | 0.000
3peptides
spectra
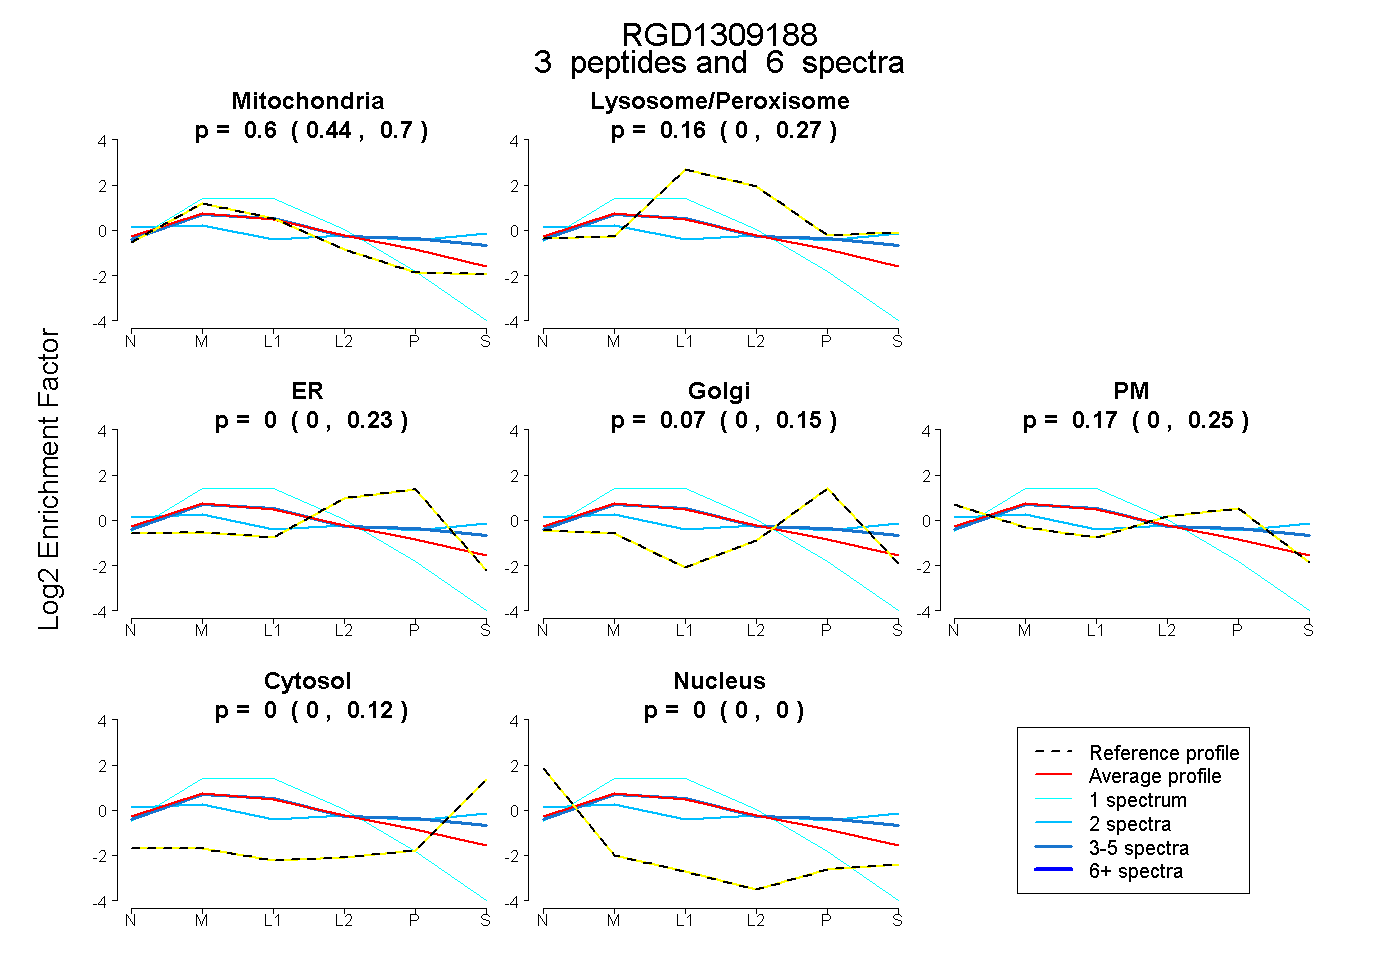
0.442 | 0.699
0.000 | 0.270
0.000 | 0.233
0.000 | 0.146
0.000 | 0.246
0.000 | 0.116
0.000 | 0.000
8peptides
spectra
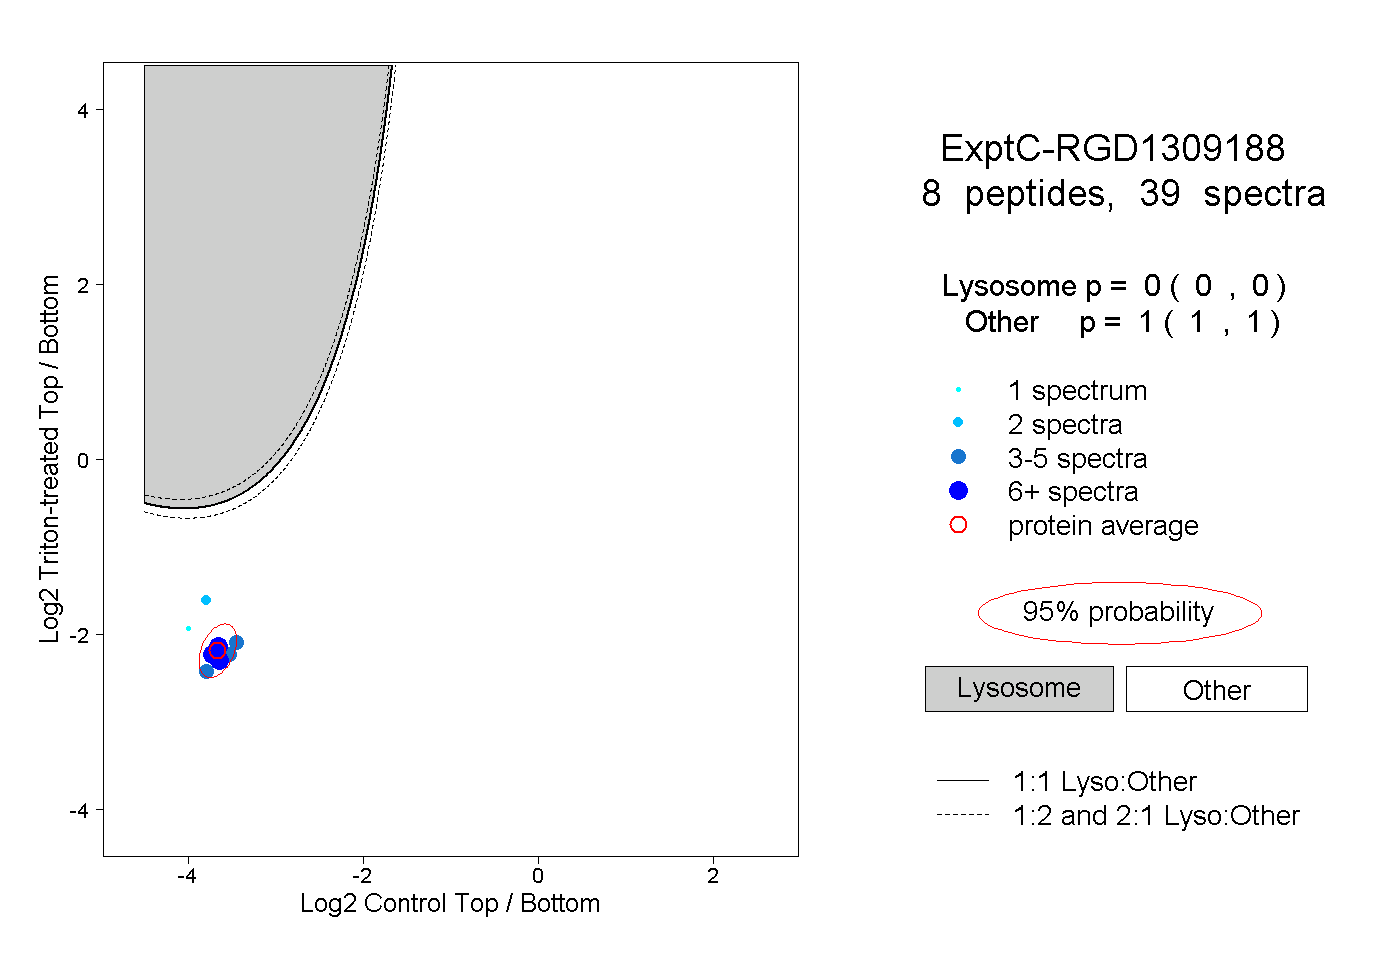
0.000 | 0.000
1.000 | 1.000
3peptides
spectra
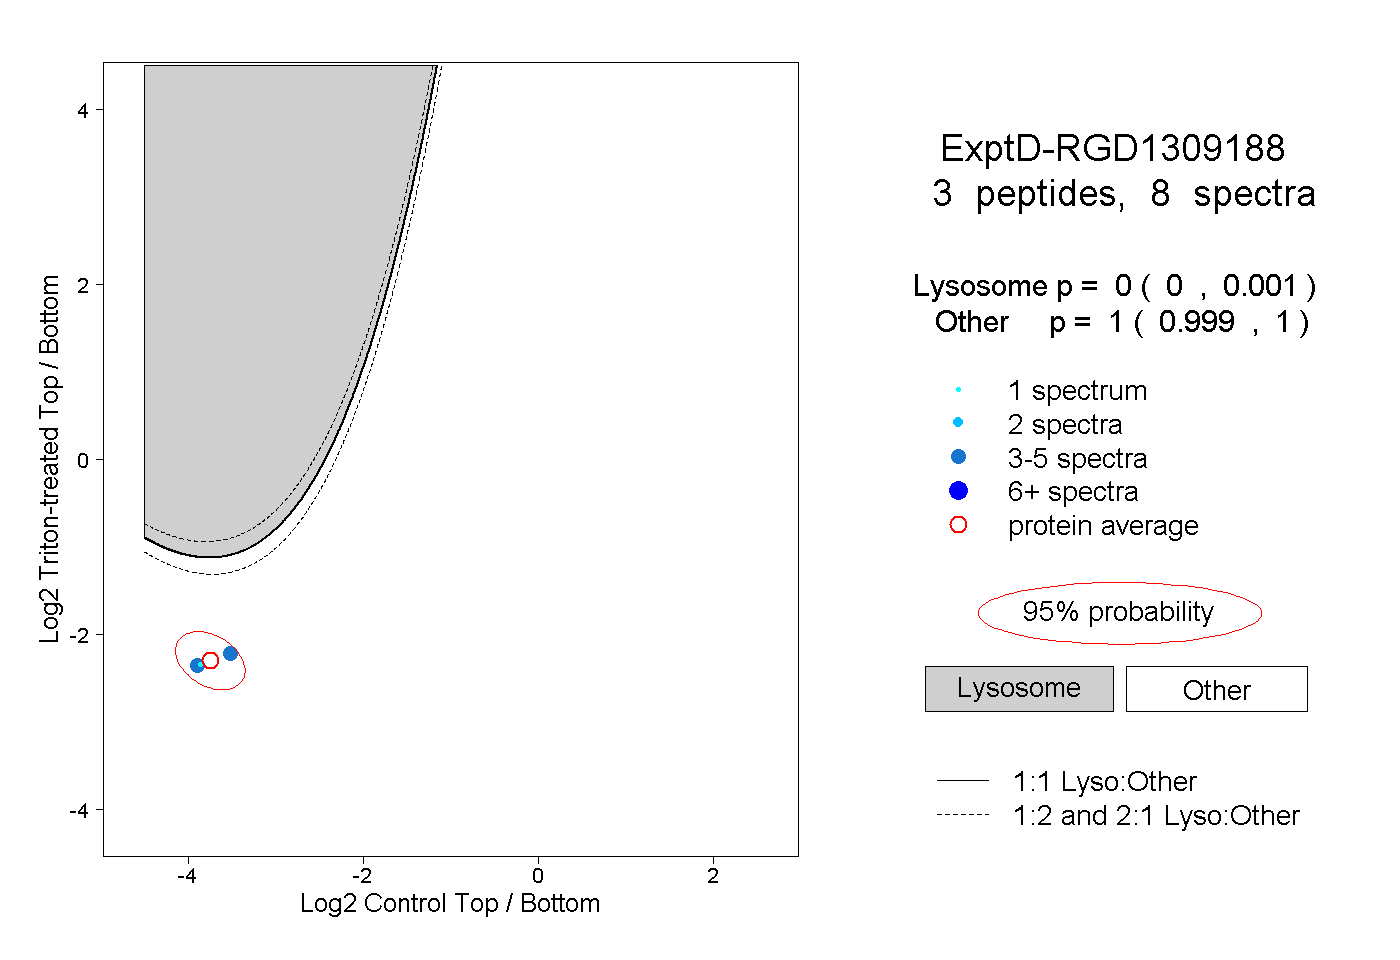
0.000 | 0.001
0.999 | 1.000