24
24peptides
spectra
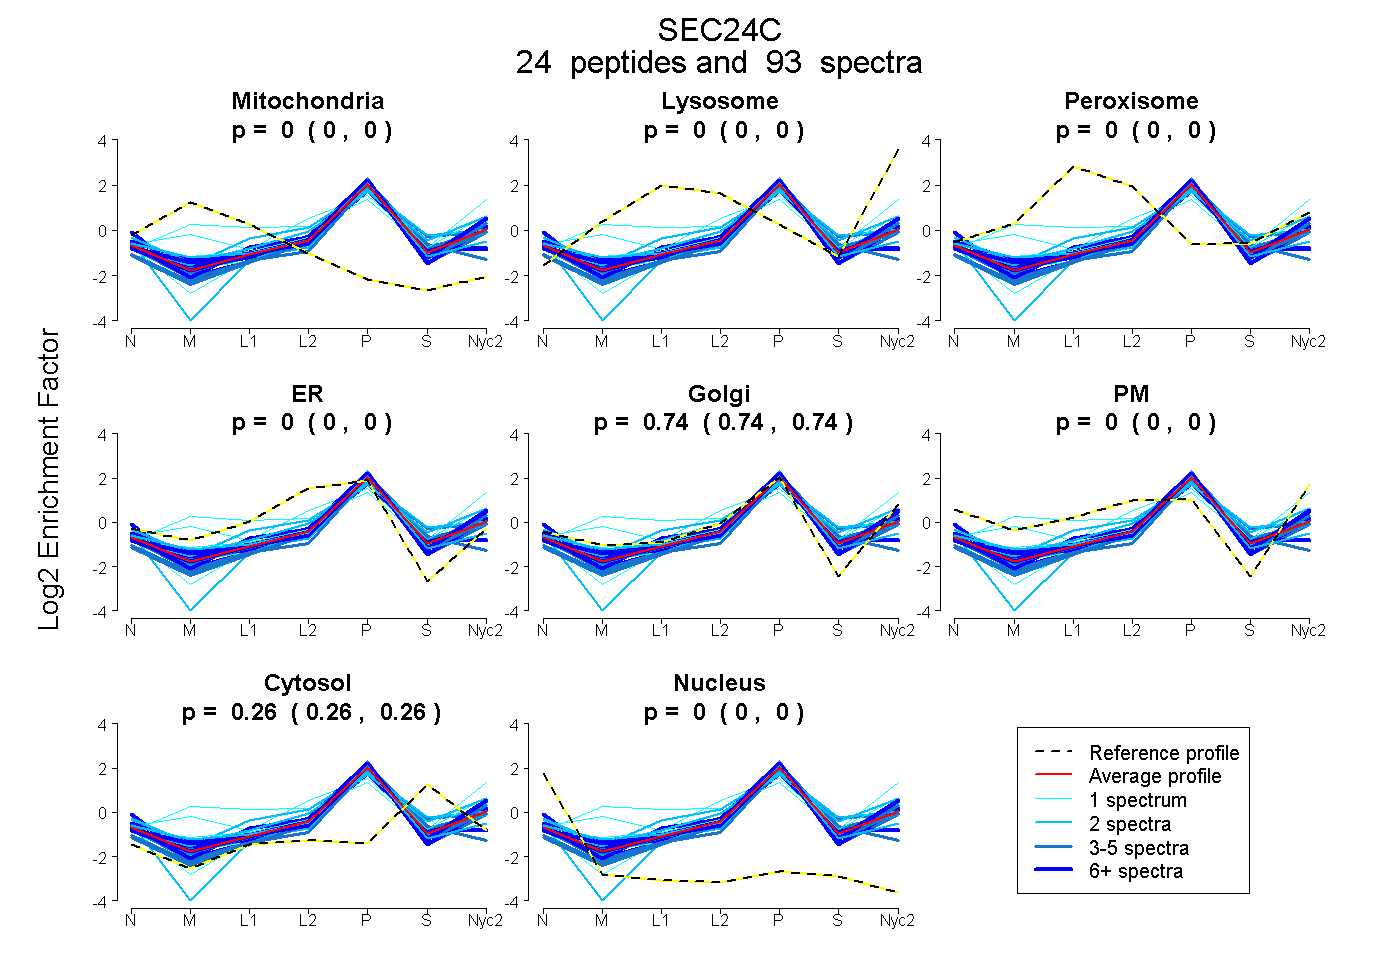
0.000 | 0.000
0.000 | 0.000
0.000 | 0.000
0.000 | 0.000
0.739 | 0.743
0.000 | 0.000
0.256 | 0.261
0.000 | 0.000
14peptides
spectra
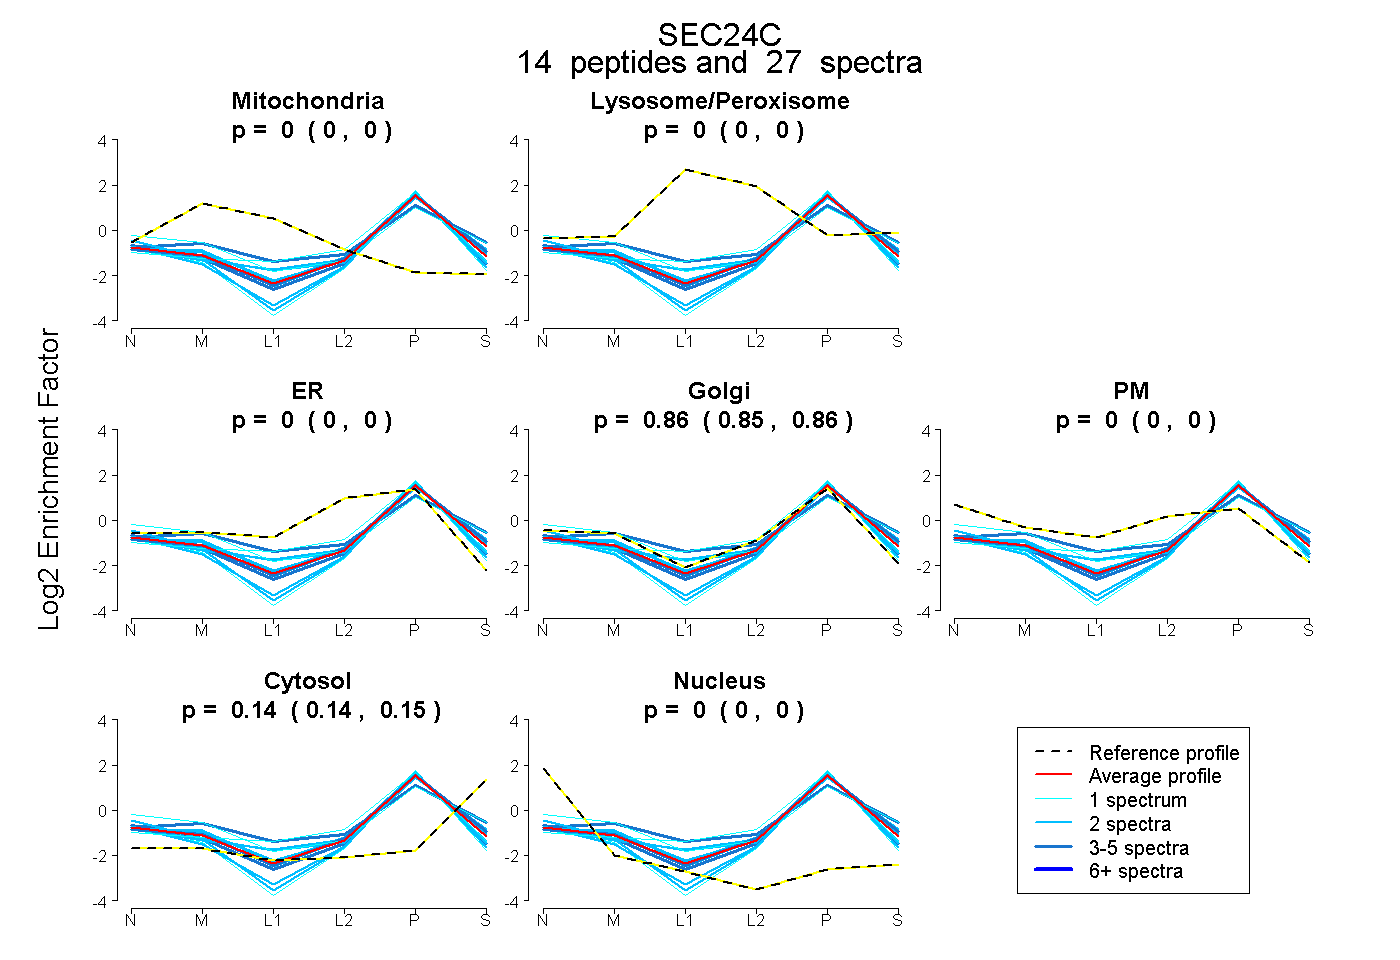
0.000 | 0.000
0.000 | 0.000
0.000 | 0.000
0.853 | 0.863
0.000 | 0.000
0.135 | 0.146
0.000 | 0.000
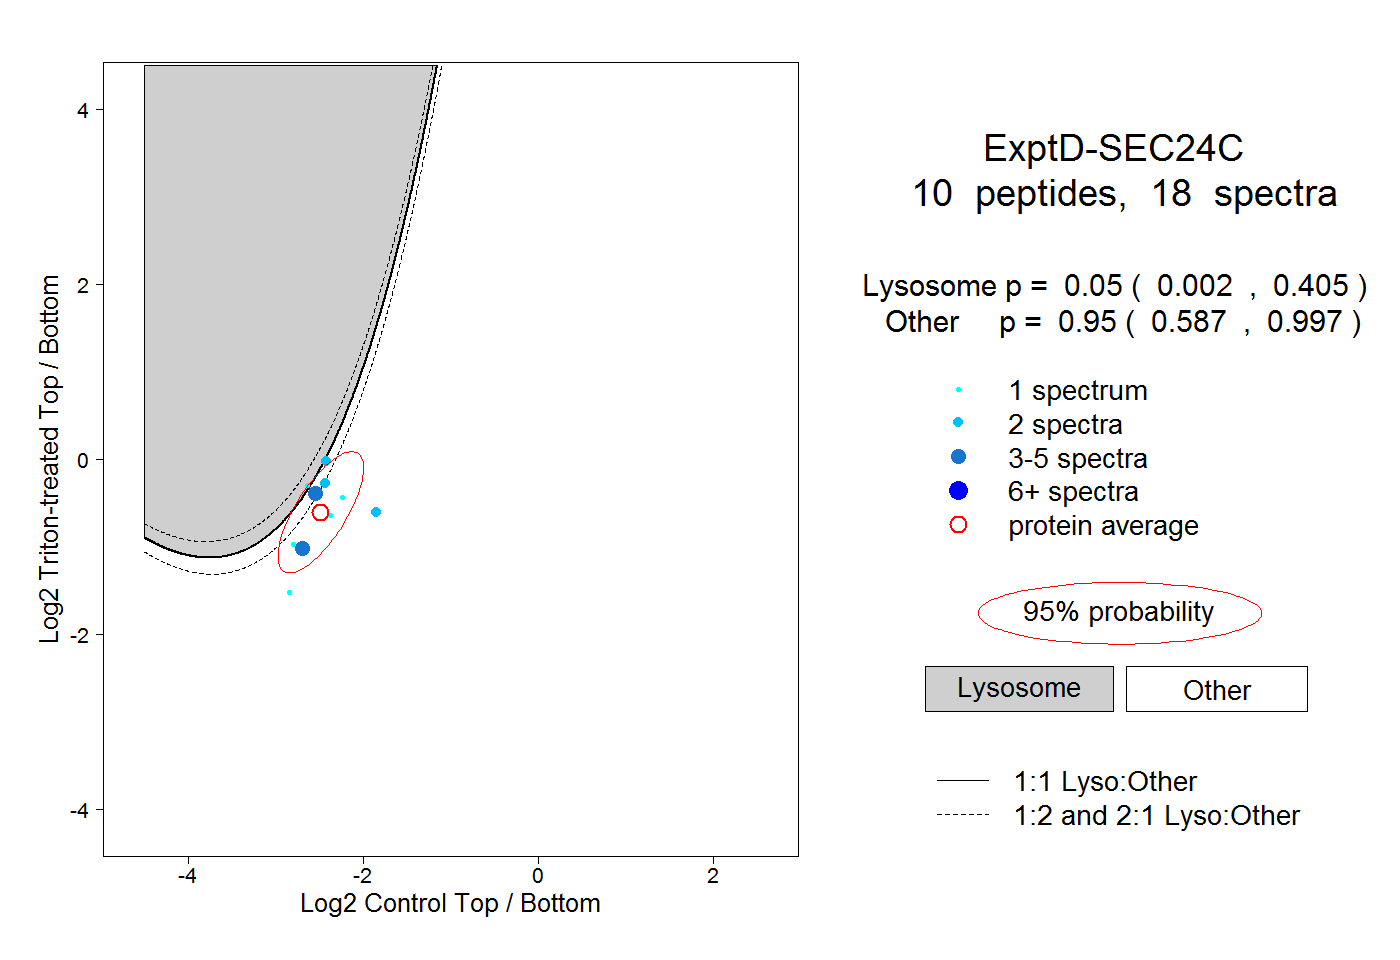
21peptides
spectra
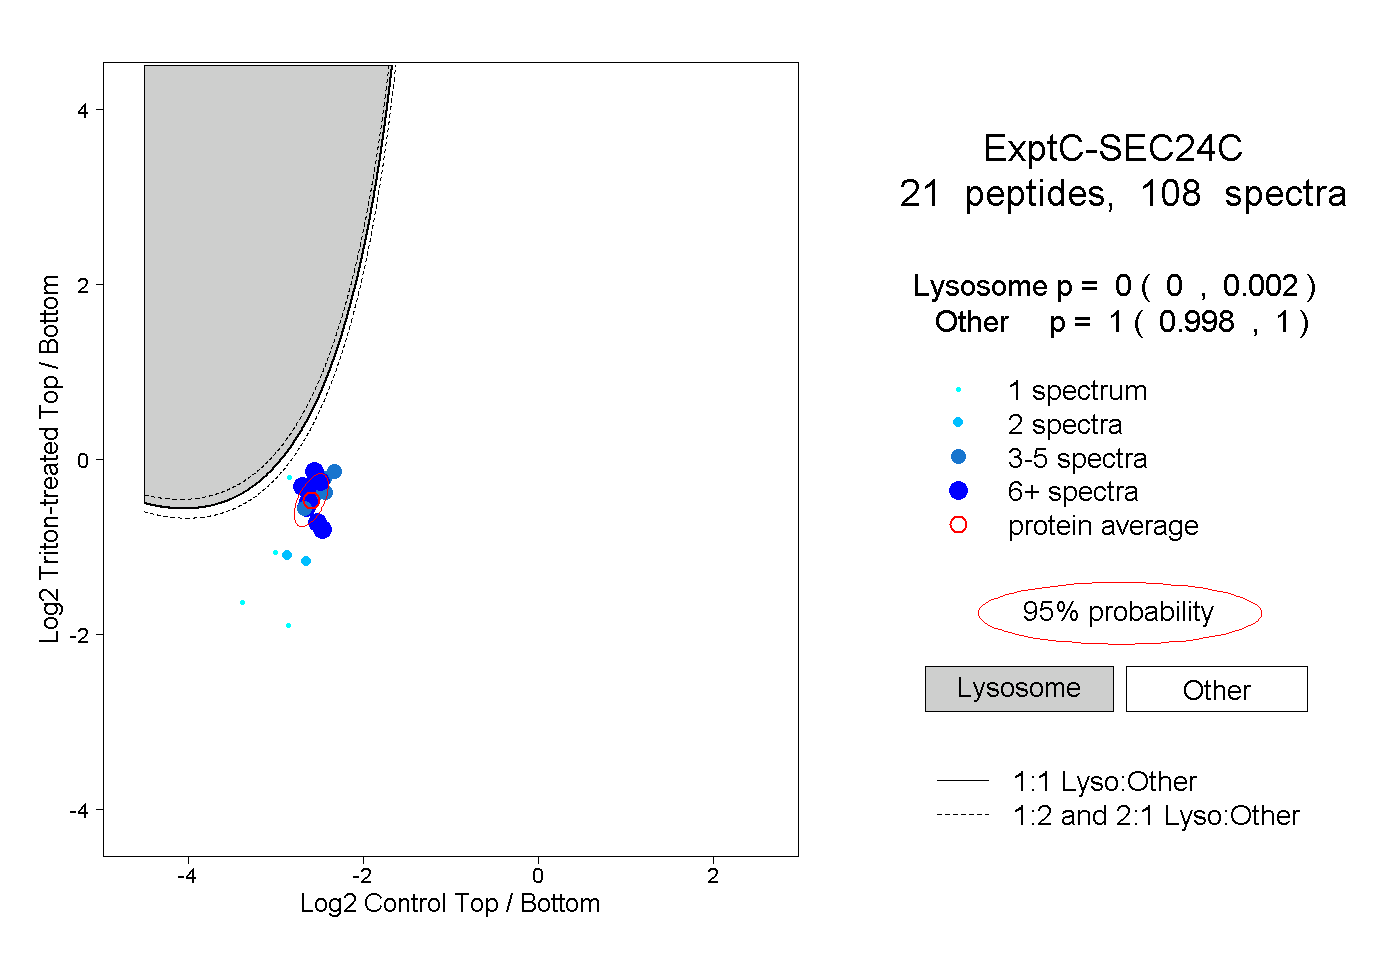
0.000 | 0.002
0.998 | 1.000