 24
24peptides
spectra
0.000 | 0.000
0.000 | 0.000
0.000 | 0.000
0.000 | 0.000
0.739 | 0.743
0.000 | 0.000
0.256 | 0.261
0.000 | 0.000
| Plot | Mito | Lyso | Perox | ER | Golgi | PM | Cytosol | Nucleus | |||||
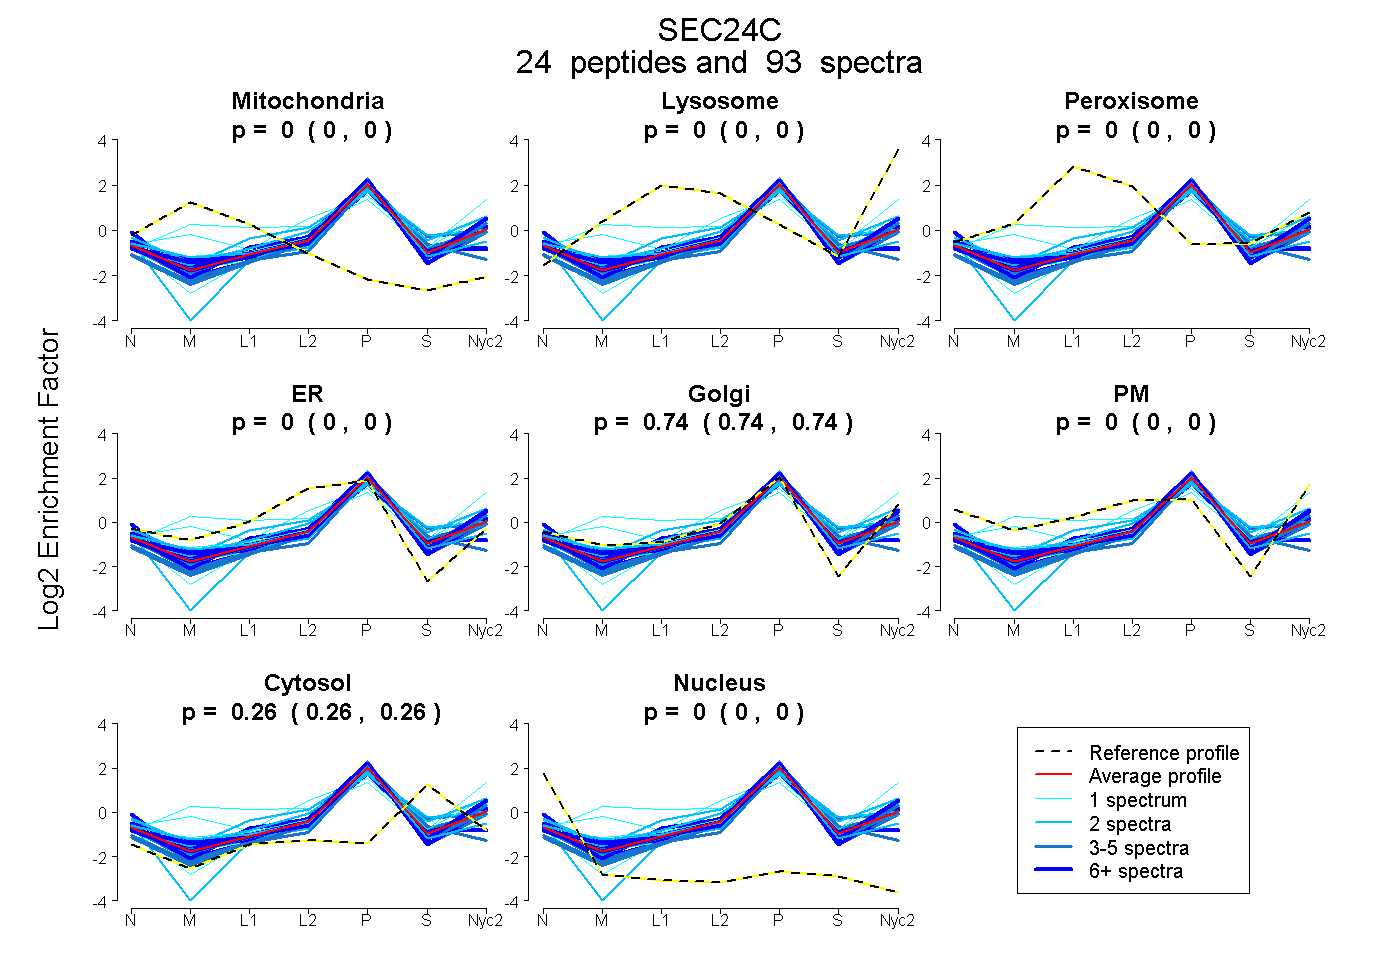
| Expt A |
24 peptides |
93 spectra |
|
0.000 0.000 | 0.000 |
0.000 0.000 | 0.000 |
0.000 0.000 | 0.000 |
0.000 0.000 | 0.000 |
0.741 0.739 | 0.743 |
0.000 0.000 | 0.000 |
0.259 0.256 | 0.261 |
0.000 0.000 | 0.000 |
| 5 spectra, EGGAEESAIR | 0.000 | 0.000 | 0.000 | 0.000 | 0.805 | 0.000 | 0.195 | 0.000 | ||
| 1 spectrum, LFLFHTSLPIAEAPGK | 0.058 | 0.061 | 0.249 | 0.000 | 0.541 | 0.000 | 0.090 | 0.000 | ||
| 10 spectra, VLHFYNVK | 0.000 | 0.000 | 0.000 | 0.000 | 0.806 | 0.000 | 0.194 | 0.000 | ||
| 2 spectra, GQVPPLVTTNFLVK | 0.000 | 0.000 | 0.000 | 0.000 | 0.660 | 0.000 | 0.340 | 0.000 | ||
| 1 spectrum, AVVSSPVK | 0.000 | 0.000 | 0.000 | 0.000 | 0.802 | 0.000 | 0.198 | 0.000 | ||
| 5 spectra, SLLDYLPR | 0.000 | 0.000 | 0.000 | 0.000 | 0.650 | 0.000 | 0.350 | 0.000 | ||
| 2 spectra, GLIDTLR | 0.000 | 0.000 | 0.000 | 0.000 | 0.777 | 0.000 | 0.223 | 0.000 | ||
| 3 spectra, GSEPFVTGVR | 0.000 | 0.000 | 0.000 | 0.000 | 0.628 | 0.000 | 0.372 | 0.000 | ||
| 6 spectra, QAQVPLAAVIKPLAR | 0.000 | 0.000 | 0.000 | 0.000 | 0.829 | 0.000 | 0.171 | 0.000 | ||
| 1 spectrum, IHNLALNCCTQLADLYR | 0.000 | 0.258 | 0.000 | 0.000 | 0.601 | 0.000 | 0.141 | 0.000 | ||
| 3 spectra, SPLDSTTEPPAVR | 0.000 | 0.000 | 0.000 | 0.000 | 0.783 | 0.000 | 0.217 | 0.000 | ||
| 7 spectra, AAECAGK | 0.000 | 0.000 | 0.000 | 0.164 | 0.463 | 0.000 | 0.296 | 0.077 | ||
| 2 spectra, TVTVEFK | 0.000 | 0.050 | 0.017 | 0.000 | 0.662 | 0.000 | 0.270 | 0.000 | ||
| 2 spectra, SLSGGASYVDFLCHMHK | 0.000 | 0.039 | 0.014 | 0.276 | 0.337 | 0.000 | 0.334 | 0.000 | ||
| 1 spectrum, ETETVFAPVIQAGMEALK | 0.000 | 0.000 | 0.000 | 0.000 | 0.696 | 0.000 | 0.304 | 0.000 | ||
| 4 spectra, LLPVYLNCVLK | 0.000 | 0.000 | 0.000 | 0.161 | 0.428 | 0.000 | 0.397 | 0.014 | ||
| 8 spectra, VVGFDAVMR | 0.000 | 0.000 | 0.000 | 0.000 | 0.804 | 0.000 | 0.196 | 0.000 | ||
| 9 spectra, LPPEEASPYVVDHGESGPLR | 0.000 | 0.000 | 0.000 | 0.065 | 0.657 | 0.000 | 0.278 | 0.000 | ||
| 2 spectra, YACFQVENDQER | 0.000 | 0.000 | 0.000 | 0.136 | 0.624 | 0.000 | 0.235 | 0.005 | ||
| 4 spectra, VGFVTYNK | 0.000 | 0.000 | 0.000 | 0.000 | 0.790 | 0.000 | 0.210 | 0.000 | ||
| 2 spectra, HFLVEDK | 0.000 | 0.000 | 0.000 | 0.000 | 0.718 | 0.000 | 0.279 | 0.003 | ||
| 1 spectrum, TSTGIR | 0.000 | 0.047 | 0.000 | 0.000 | 0.732 | 0.000 | 0.221 | 0.000 | ||
| 4 spectra, DQGNASPR | 0.000 | 0.000 | 0.000 | 0.000 | 0.795 | 0.000 | 0.204 | 0.001 | ||
| 8 spectra, LICEELK | 0.000 | 0.000 | 0.000 | 0.268 | 0.403 | 0.000 | 0.315 | 0.014 |
| Plot | Mito | Lyso or Perox | ER | Golgi | PM | Cytosol | Nucleus | ||||||
| Expt B |
14 peptides |
27 spectra |
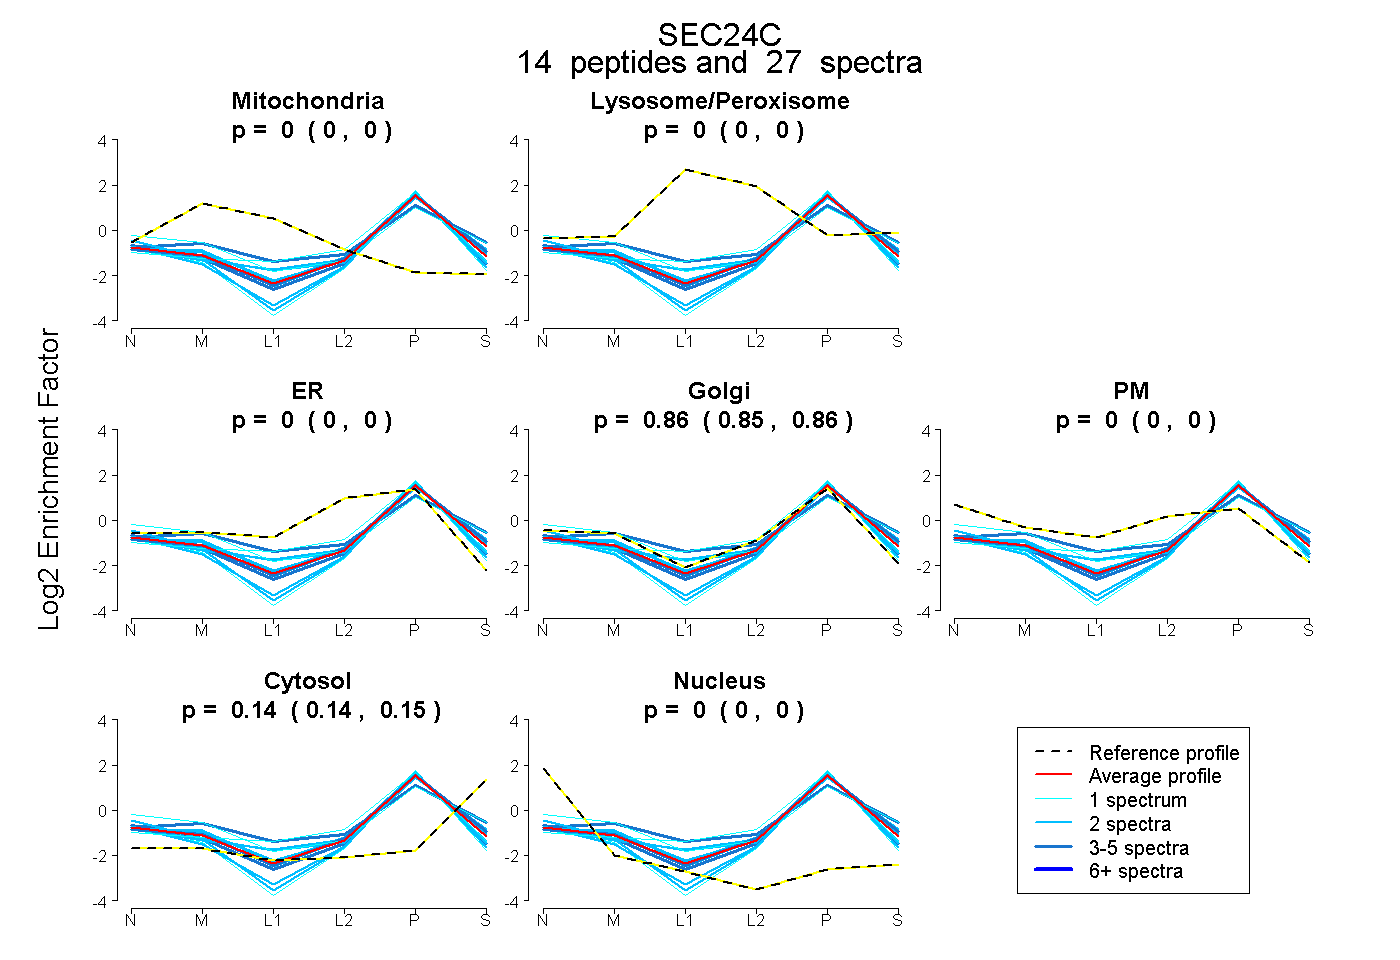 |
0.000 0.000 | 0.000 |
0.000 0.000 | 0.000 |
0.000 0.000 | 0.000 |
0.859 0.853 | 0.863 |
0.000 0.000 | 0.000 |
0.141 0.135 | 0.146 |
0.000 0.000 | 0.000 |
|||
| Plot | Lyso | Other | |||||||||||
| Expt C |
21 peptides |
108 spectra |
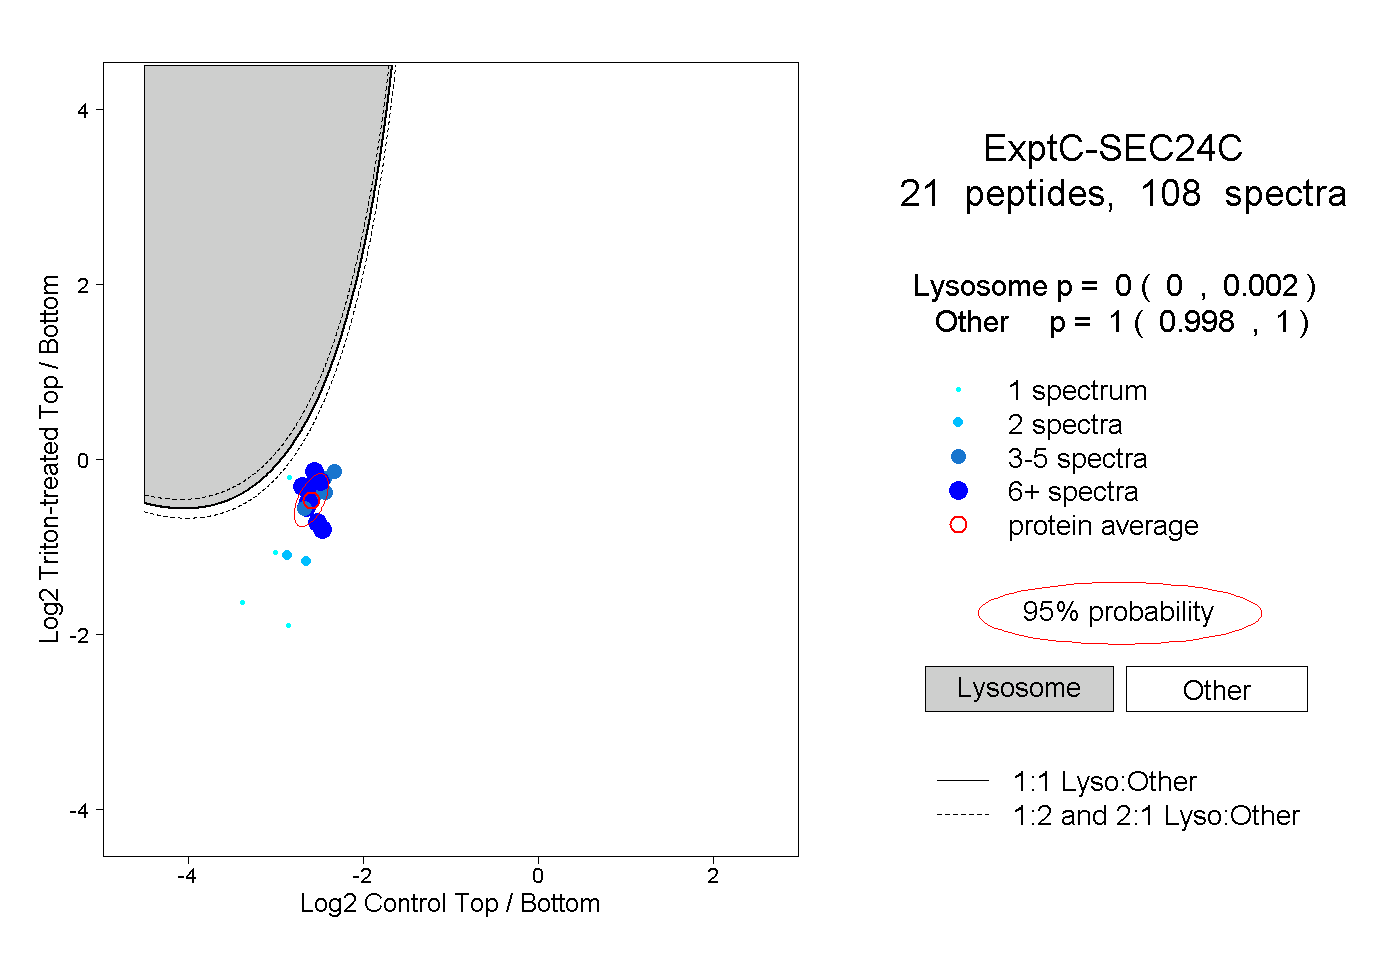 |
0.000 0.000 | 0.002 |
1.000 0.998 | 1.000 |
||||||||
| Plot | Lyso | Other | |||||||||||
| Expt D |
10 peptides |
18 spectra |
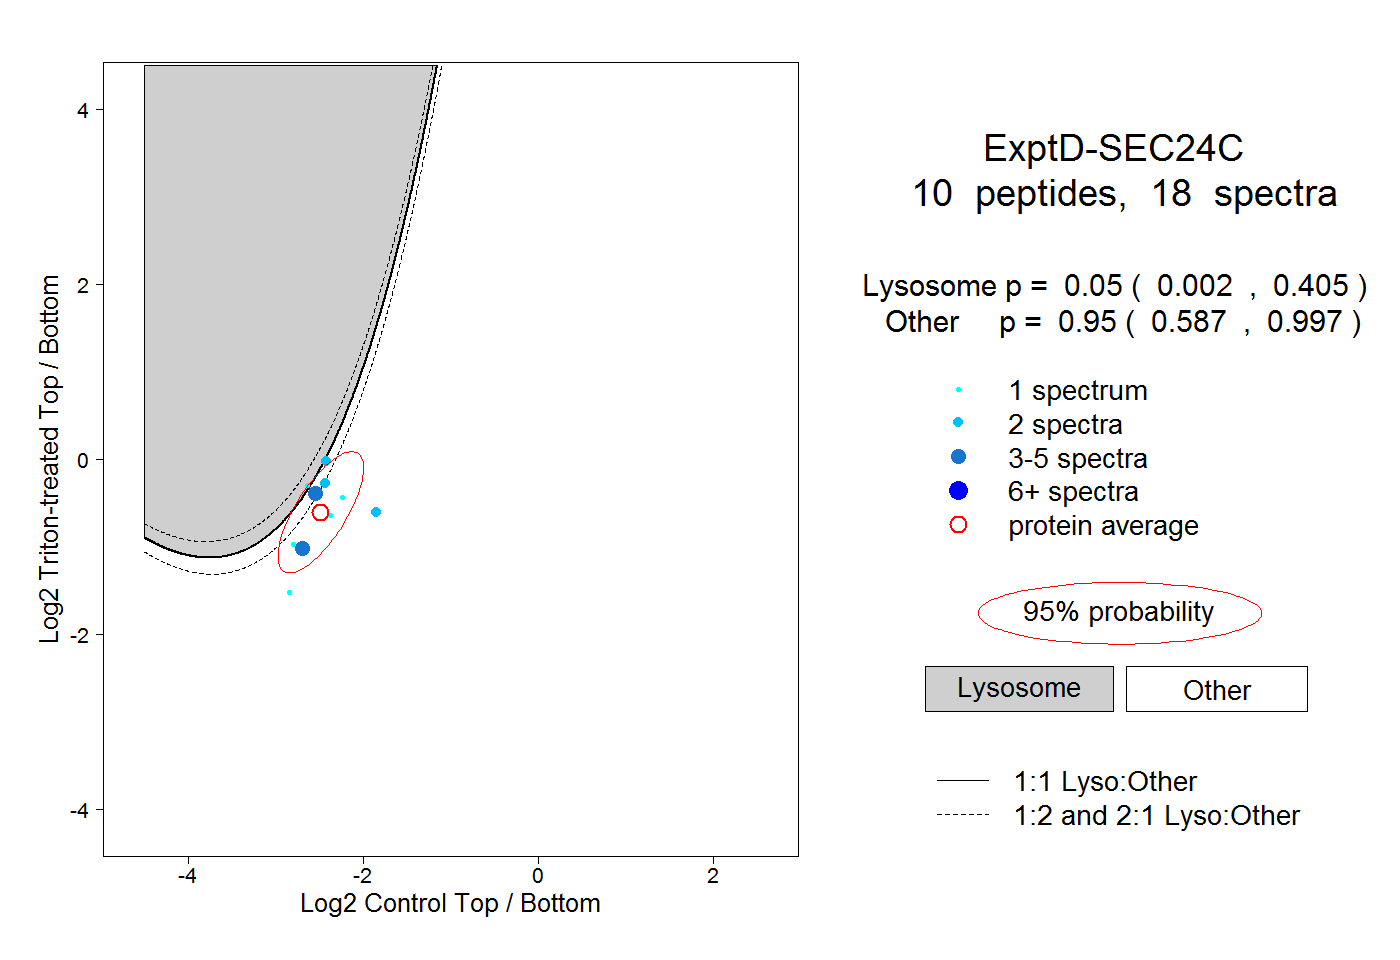 |
0.050 0.002 | 0.405 |
0.950 0.587 | 0.997 |