10
10peptides
spectra
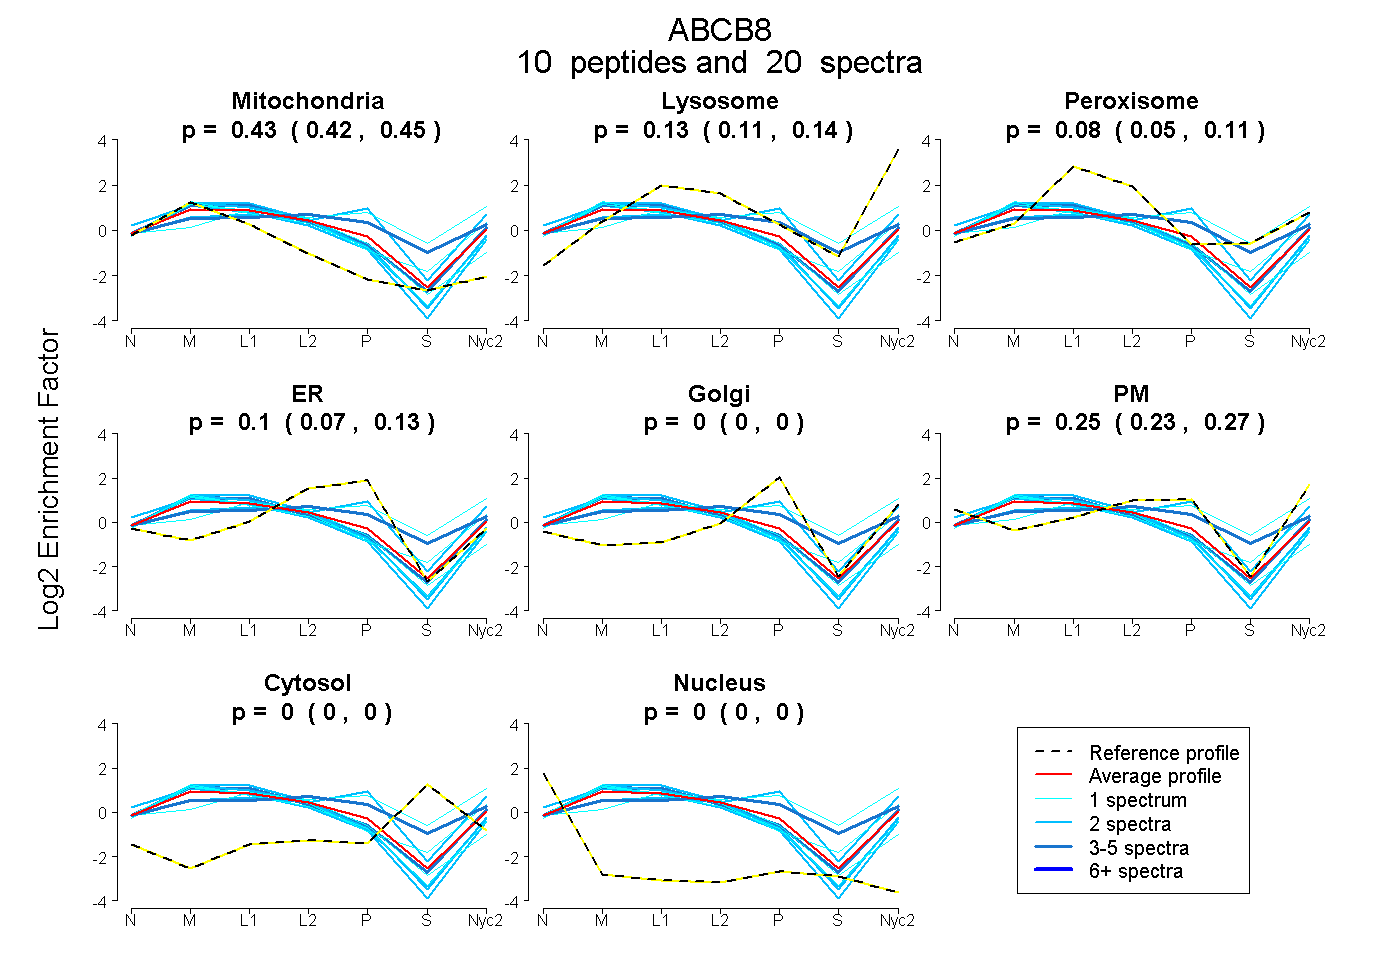
0.417 | 0.445
0.111 | 0.145
0.051 | 0.109
0.074 | 0.129
0.000 | 0.000
0.229 | 0.268
0.000 | 0.000
0.000 | 0.000
7peptides
spectra
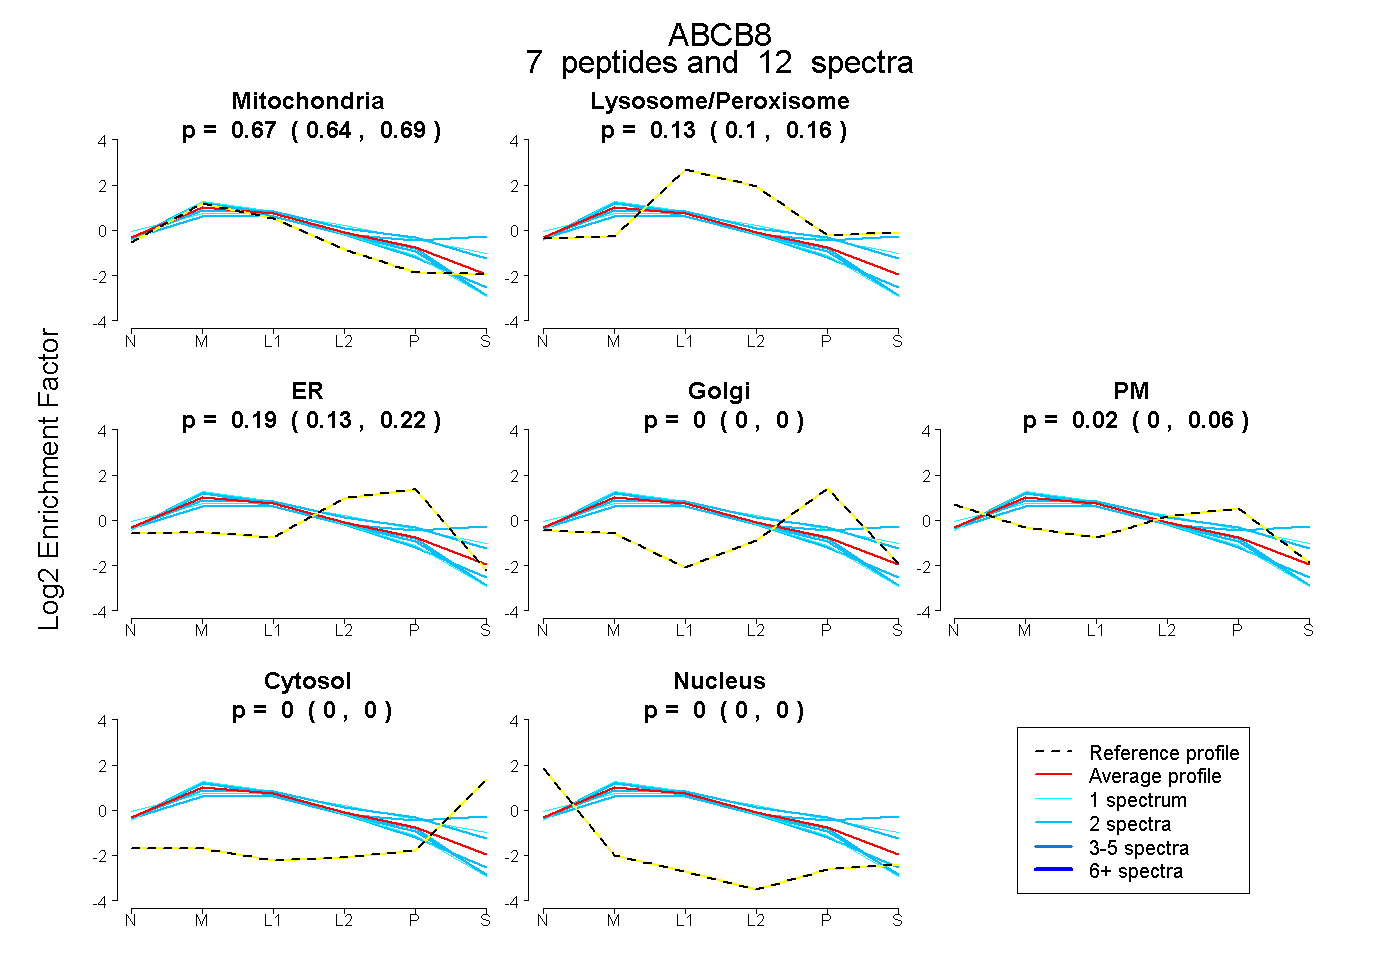
0.636 | 0.686
0.098 | 0.156
0.130 | 0.220
0.000 | 0.000
0.000 | 0.057
0.000 | 0.000
0.000 | 0.000