 10
10peptides
spectra
0.417 | 0.445
0.111 | 0.145
0.051 | 0.109
0.074 | 0.129
0.000 | 0.000
0.229 | 0.268
0.000 | 0.000
0.000 | 0.000
| Plot | Mito | Lyso | Perox | ER | Golgi | PM | Cytosol | Nucleus | |||||
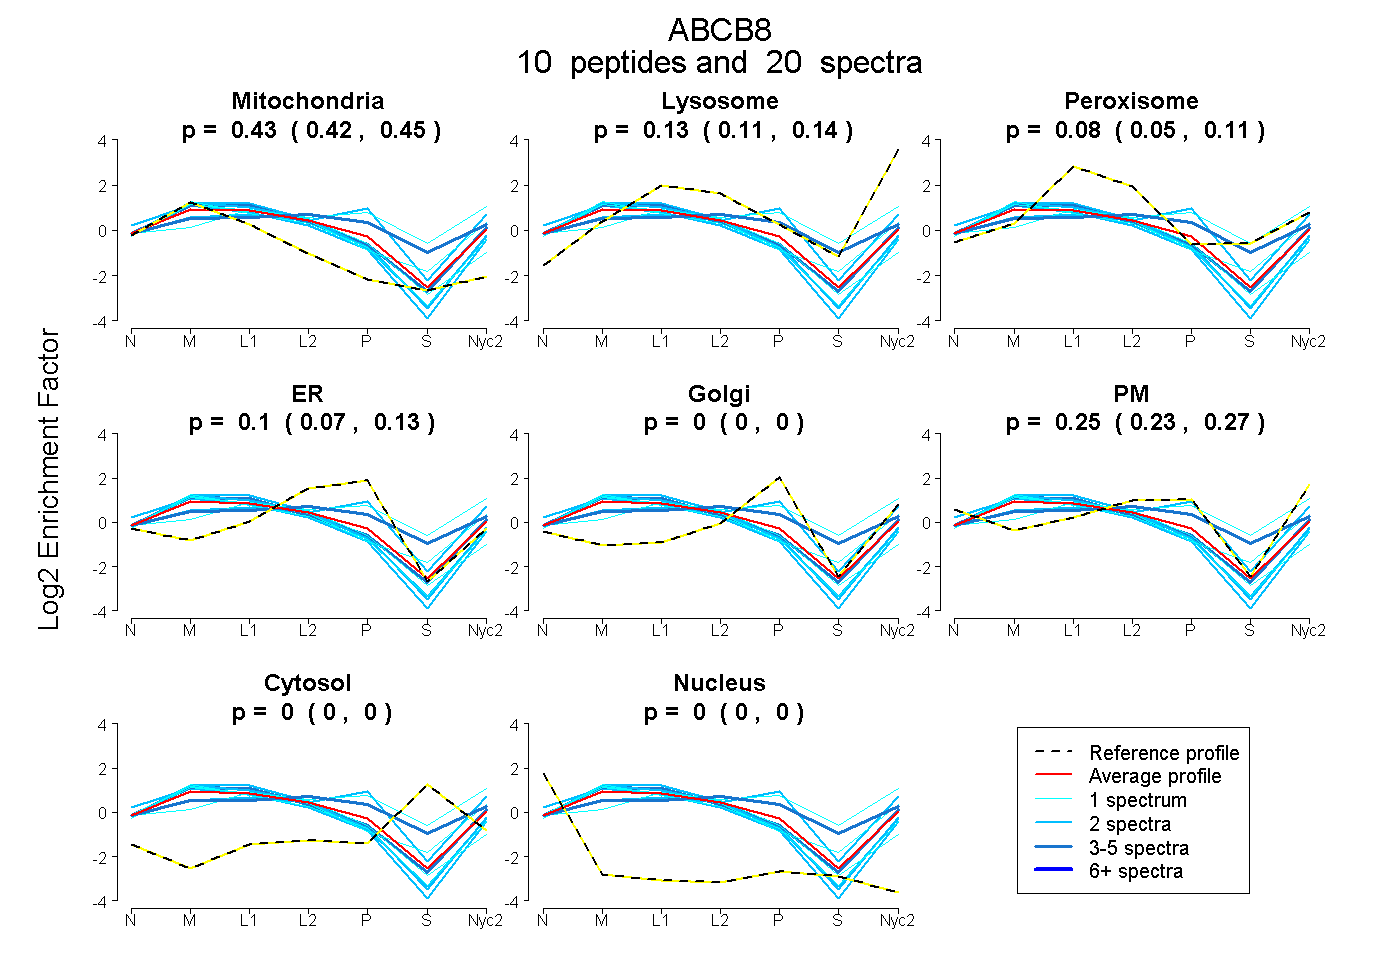
| Expt A |
10 peptides |
20 spectra |
|
0.433 0.417 | 0.445 |
0.131 0.111 | 0.145 |
0.082 0.051 | 0.109 |
0.103 0.074 | 0.129 |
0.000 0.000 | 0.000 |
0.251 0.229 | 0.268 |
0.000 0.000 | 0.000 |
0.000 0.000 | 0.000 |
| 2 spectra, ATGVADEALGSVR | 0.536 | 0.156 | 0.019 | 0.117 | 0.000 | 0.172 | 0.000 | 0.000 | ||
| 1 spectrum, QALDASLPSAPPAEKPEDHR | 0.000 | 0.086 | 0.402 | 0.000 | 0.280 | 0.135 | 0.097 | 0.000 | ||
| 2 spectra, FYDPTAGVVTLDGHDLR | 0.214 | 0.190 | 0.009 | 0.181 | 0.109 | 0.297 | 0.000 | 0.000 | ||
| 1 spectrum, QDIAFFDAK | 0.479 | 0.265 | 0.116 | 0.000 | 0.000 | 0.140 | 0.000 | 0.000 | ||
| 4 spectra, GSPPAQPTR | 0.487 | 0.166 | 0.080 | 0.000 | 0.000 | 0.267 | 0.000 | 0.000 | ||
| 2 spectra, ALFSSLLR | 0.583 | 0.000 | 0.000 | 0.000 | 0.000 | 0.417 | 0.000 | 0.000 | ||
| 2 spectra, IVQEALDR | 0.561 | 0.165 | 0.000 | 0.111 | 0.000 | 0.163 | 0.000 | 0.000 | ||
| 1 spectrum, LVISQGLR | 0.586 | 0.135 | 0.000 | 0.115 | 0.000 | 0.163 | 0.000 | 0.000 | ||
| 1 spectrum, QCQEQIAR | 0.539 | 0.000 | 0.161 | 0.264 | 0.000 | 0.036 | 0.000 | 0.000 | ||
| 4 spectra, TVLVIAHR | 0.154 | 0.000 | 0.412 | 0.000 | 0.300 | 0.086 | 0.048 | 0.000 |
| Plot | Mito | Lyso or Perox | ER | Golgi | PM | Cytosol | Nucleus | ||||||
| Expt B |
7 peptides |
12 spectra |
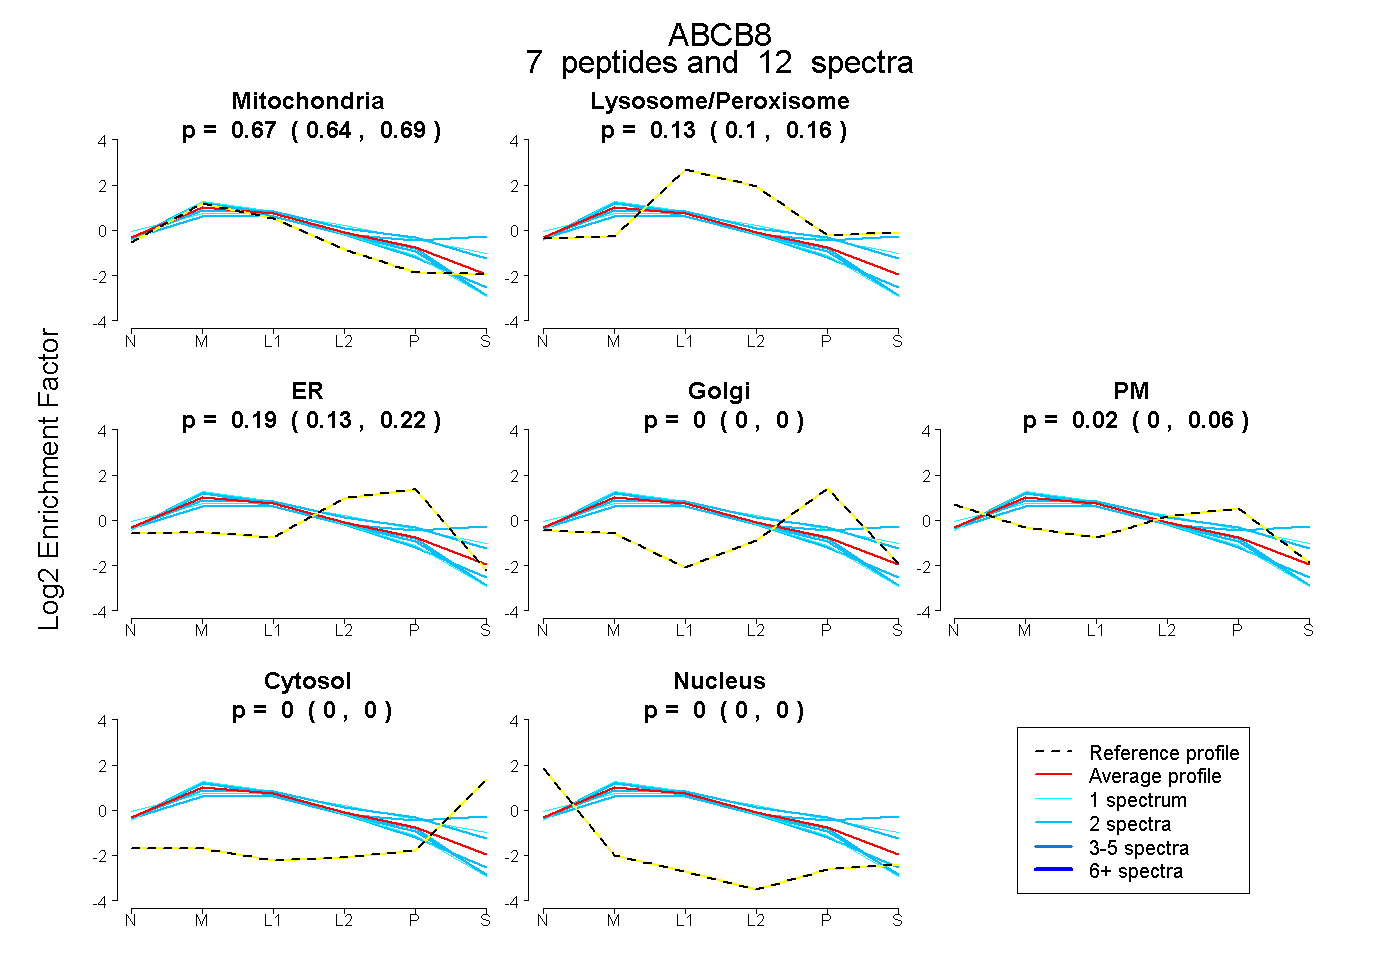 |
0.666 0.636 | 0.686 |
0.129 0.098 | 0.156 |
0.189 0.130 | 0.220 |
0.000 0.000 | 0.000 |
0.016 0.000 | 0.057 |
0.000 0.000 | 0.000 |
0.000 0.000 | 0.000 |
|||
| Plot | Lyso | Other | |||||||||||
| Expt C |
21 peptides |
96 spectra |
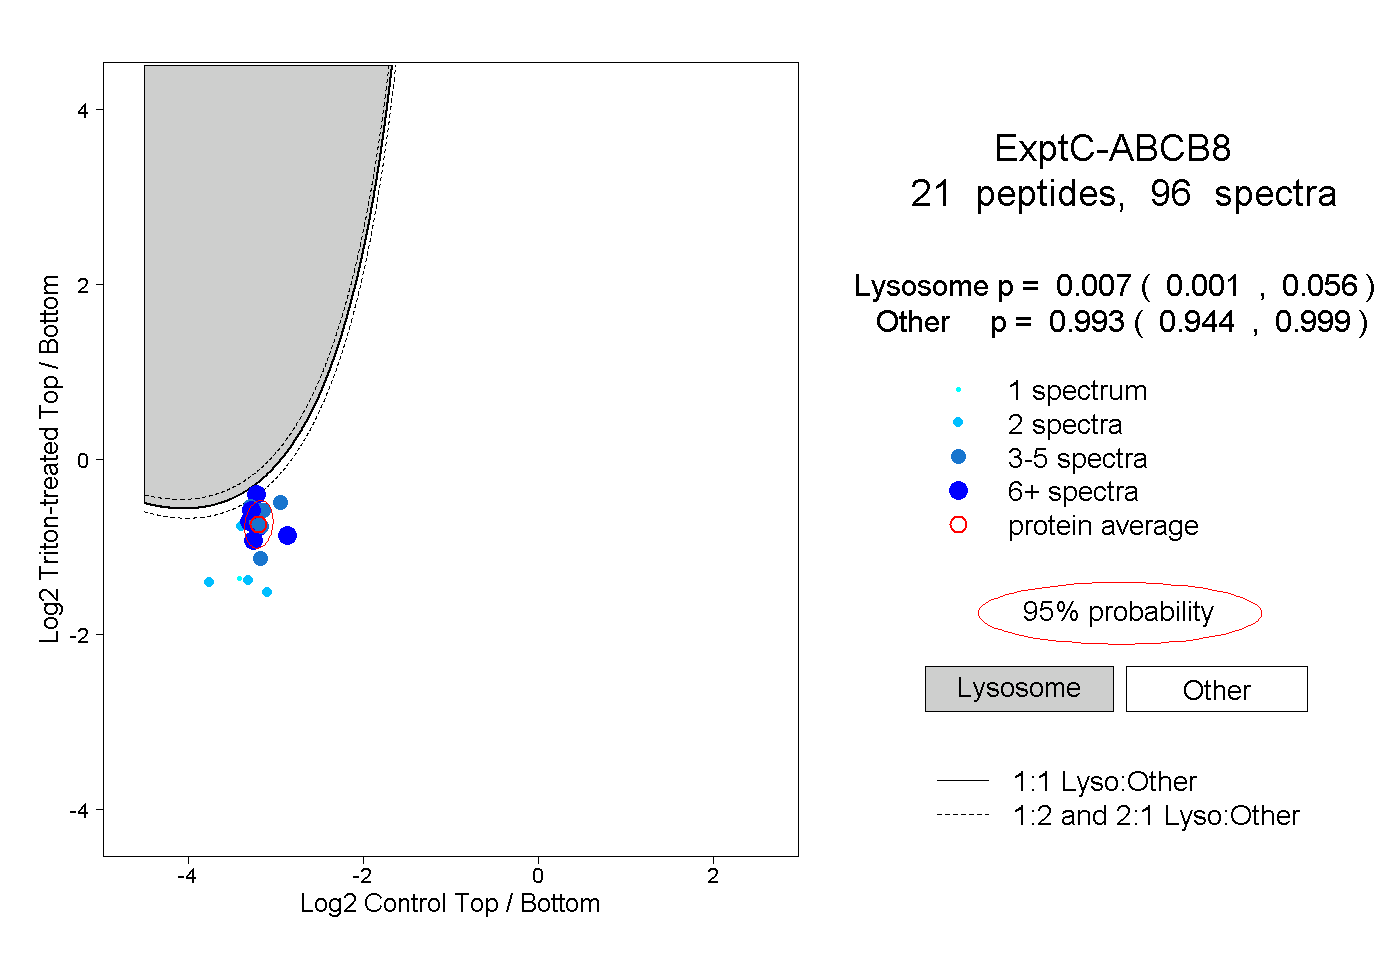 |
0.007 0.001 | 0.056 |
0.993 0.944 | 0.999 |
||||||||
| Plot | Lyso | Other | |||||||||||
| Expt D |
6 peptides |
13 spectra |
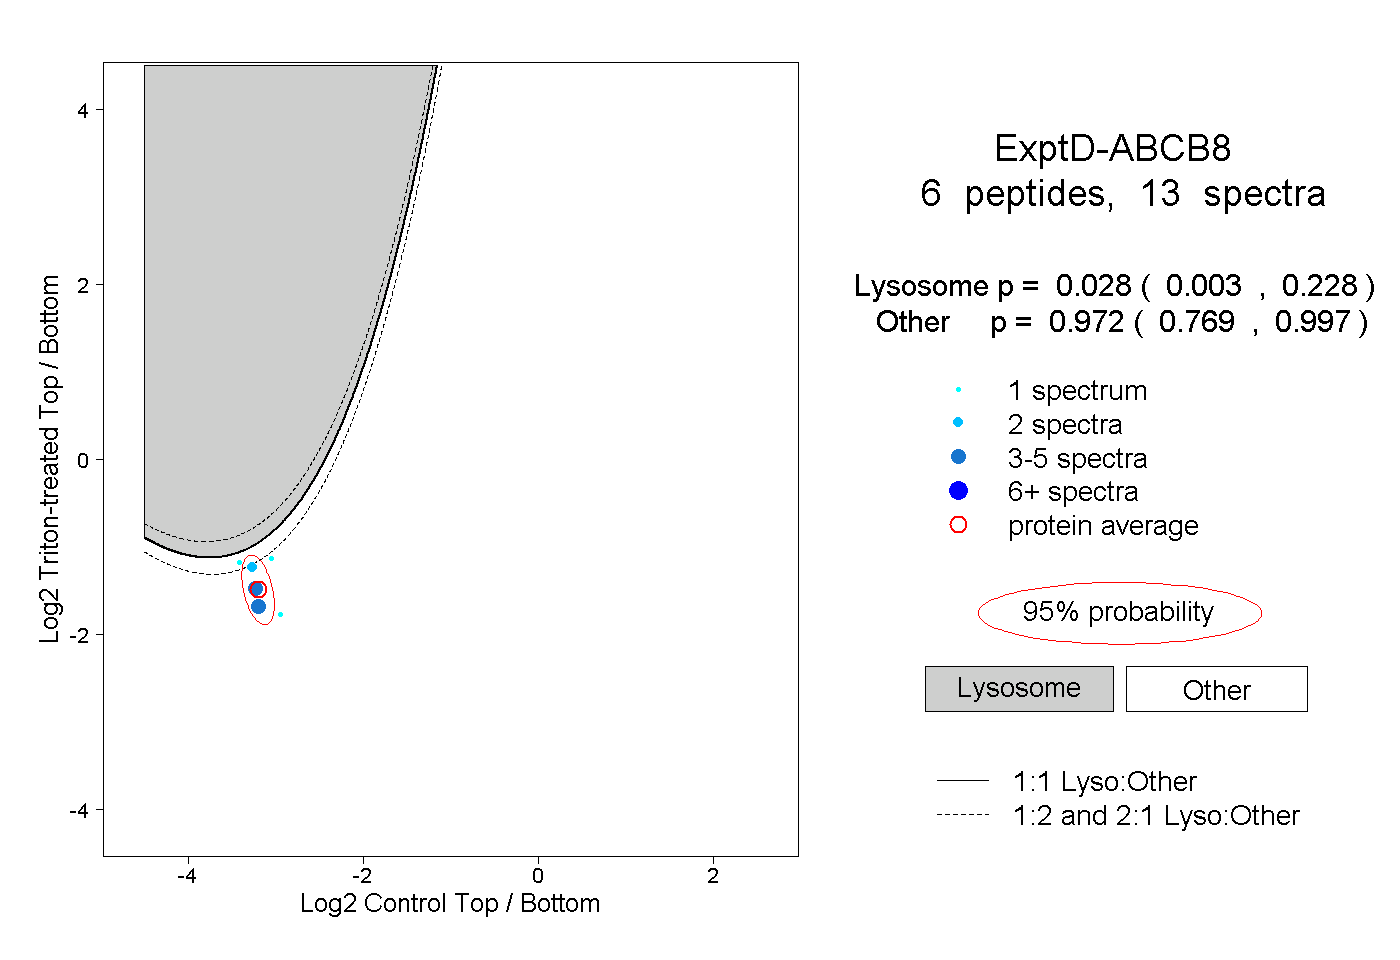 |
0.028 0.003 | 0.228 |
0.972 0.769 | 0.997 |