SLCO2A1
[ENSRNOP00000012162]
Main page
| | | Plot |
Mito |
Lyso |
|
Perox |
ER |
Golgi |
PM |
Cytosol |
Nucleus |
|
| Expt A |
 12
12
peptides |
46
spectra |
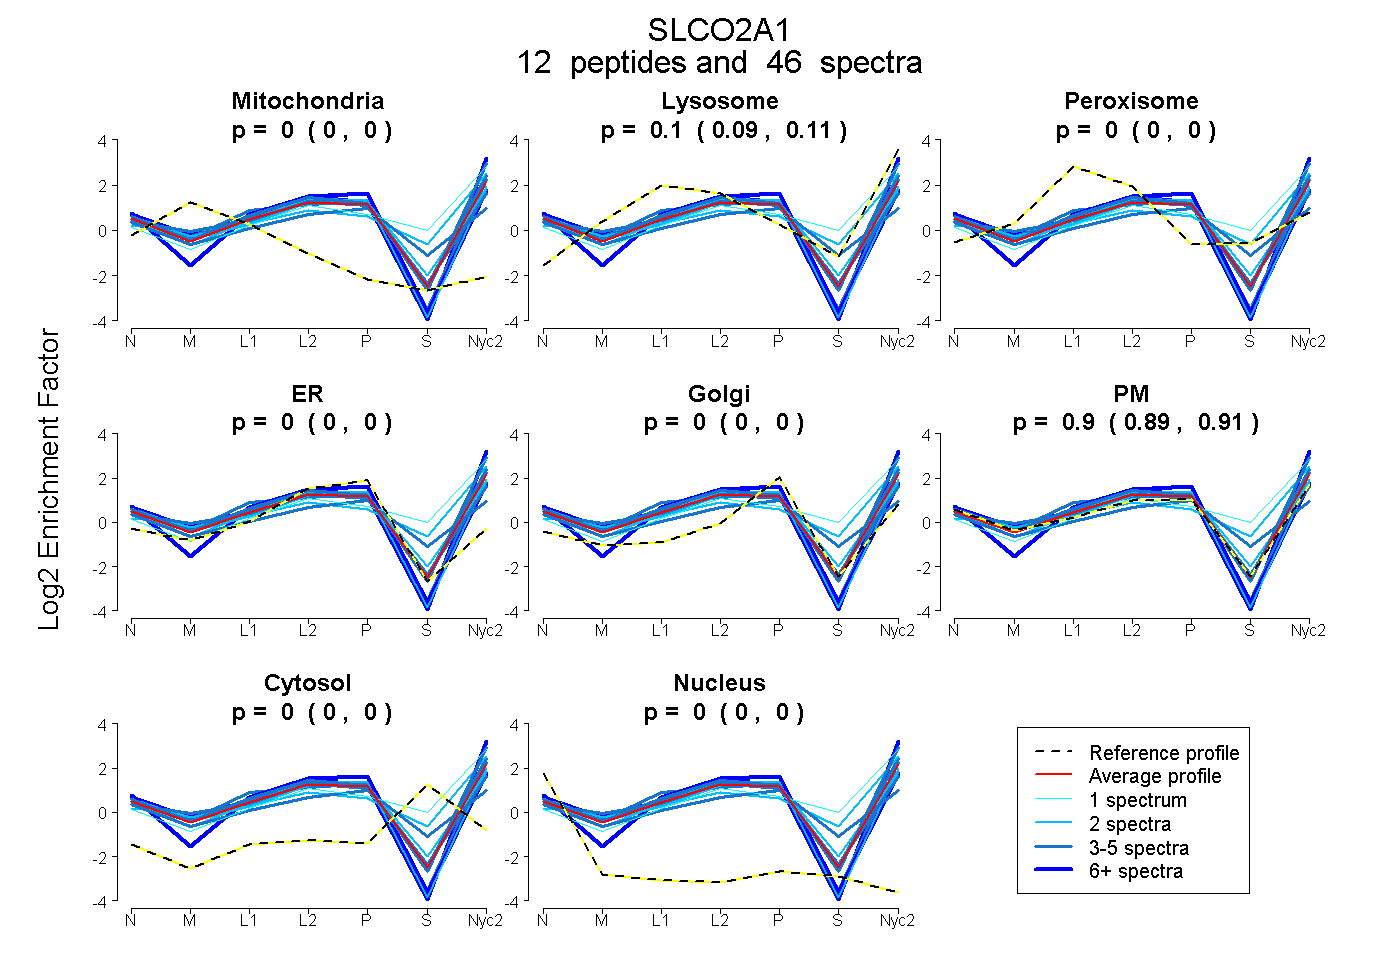 |
0.000
0.000 | 0.000 |
0.099
0.087 | 0.109 |
|
0.000
0.000 | 0.000 |
0.000
0.000 | 0.000 |
0.000
0.000 | 0.000 |
0.901
0.888 | 0.911 |
0.000
0.000 | 0.000 |
0.000
0.000 | 0.000 |
|
| | | Plot |
Mito |
|
Lyso or Perox |
|
ER |
Golgi |
PM |
Cytosol |
Nucleus |
|
| Expt B |
4
peptides |
7
spectra |
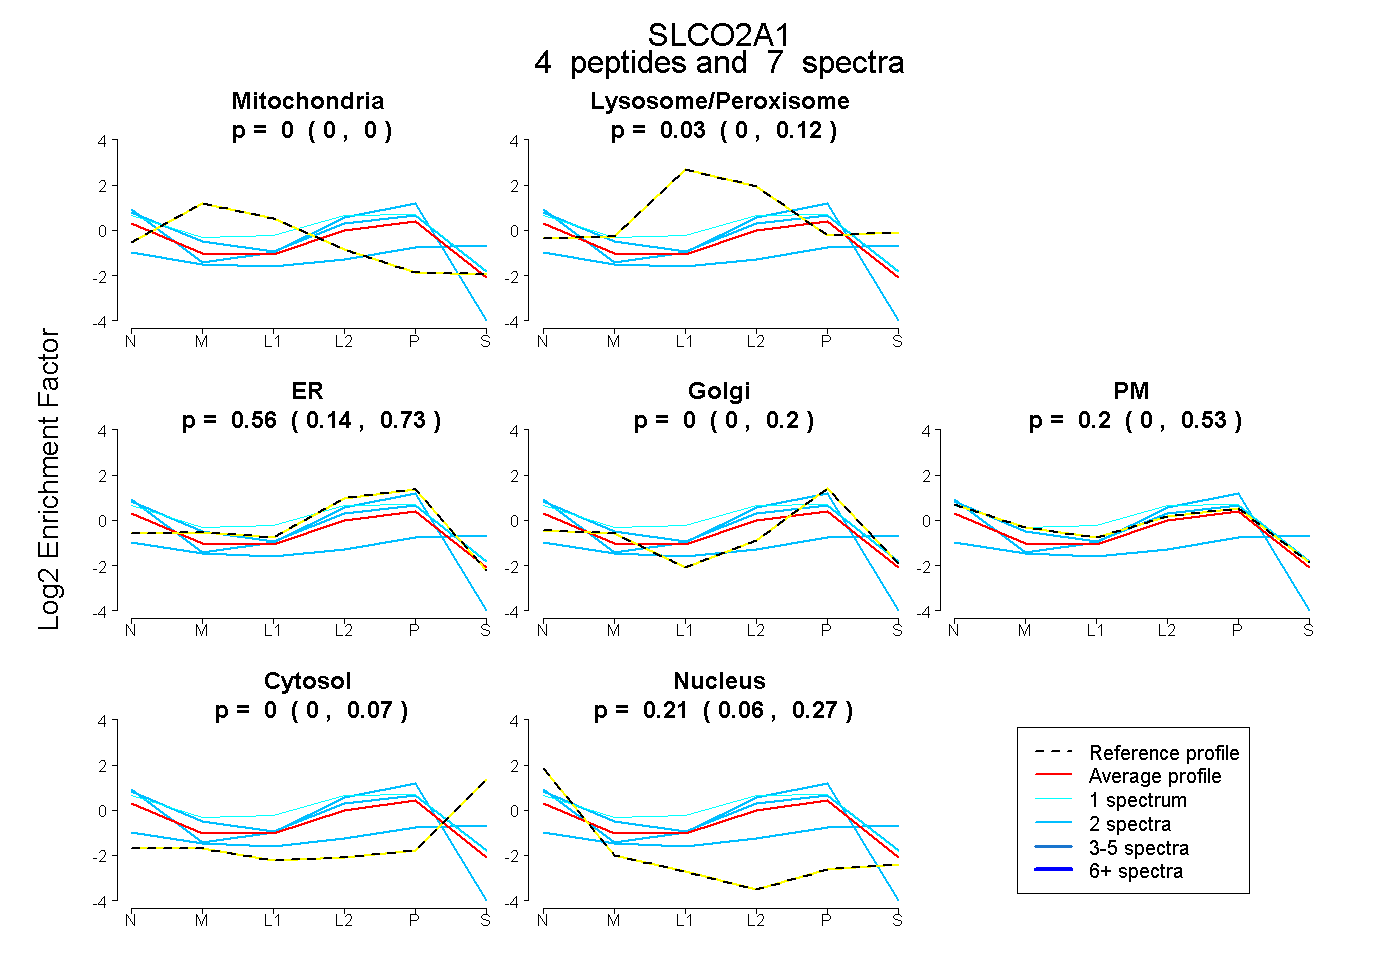 |
0.000
0.000 | 0.000 |
|
0.029
0.000 | 0.118 |
|
0.564
0.139 | 0.732 |
0.000
0.000 | 0.201 |
0.198
0.000 | 0.529 |
0.000
0.000 | 0.075 |
0.208
0.063 | 0.266 |
|
| 1 spectrum, WNYLCSGR |
0.000 |
|
0.131 |
|
0.119 |
0.000 |
0.750 |
0.000 |
0.000 |
|
| 2 spectra, GLLLKPGAR |
0.000 |
|
0.000 |
|
0.825 |
0.000 |
0.000 |
0.000 |
0.175 |
|
| 2 spectra, VVNQDEK |
0.002 |
|
0.000 |
|
0.367 |
0.000 |
0.000 |
0.482 |
0.149 |
|
| 2 spectra, SSFQTDLCQK |
0.000 |
|
0.000 |
|
0.019 |
0.014 |
0.968 |
0.000 |
0.000 |
|
| | | Plot |
|
Lyso |
|
|
|
|
|
|
|
Other |
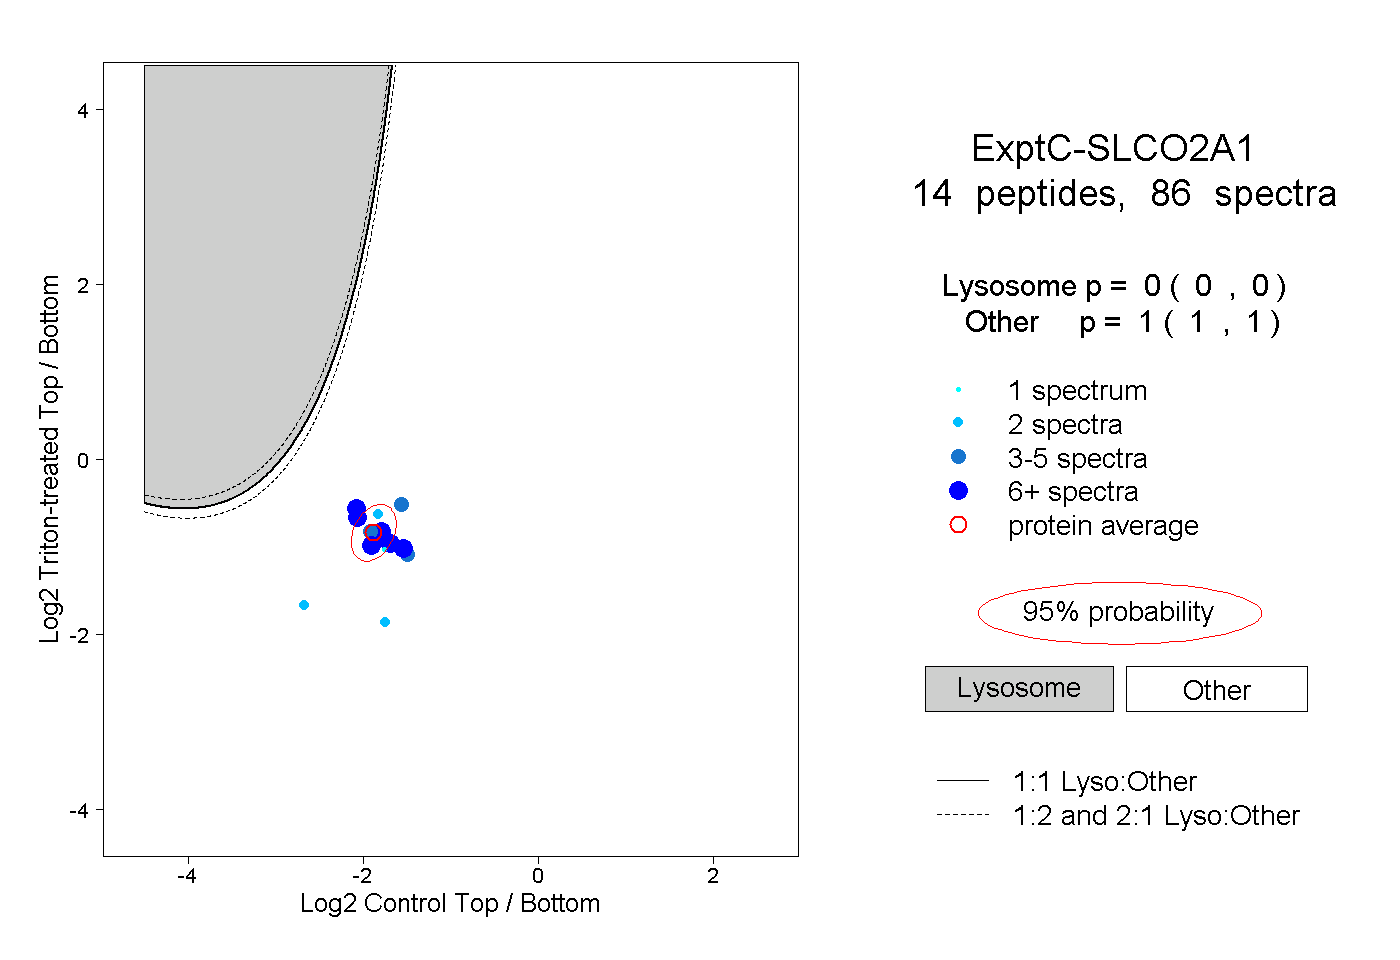
| Expt C |
14
peptides |
86
spectra |
 |
|
0.000
0.000 | 0.000 |
|
|
|
|
|
|
|
1.000
1.000 | 1.000 |
| | | Plot |
|
Lyso |
|
|
|
|
|
|
|
Other |
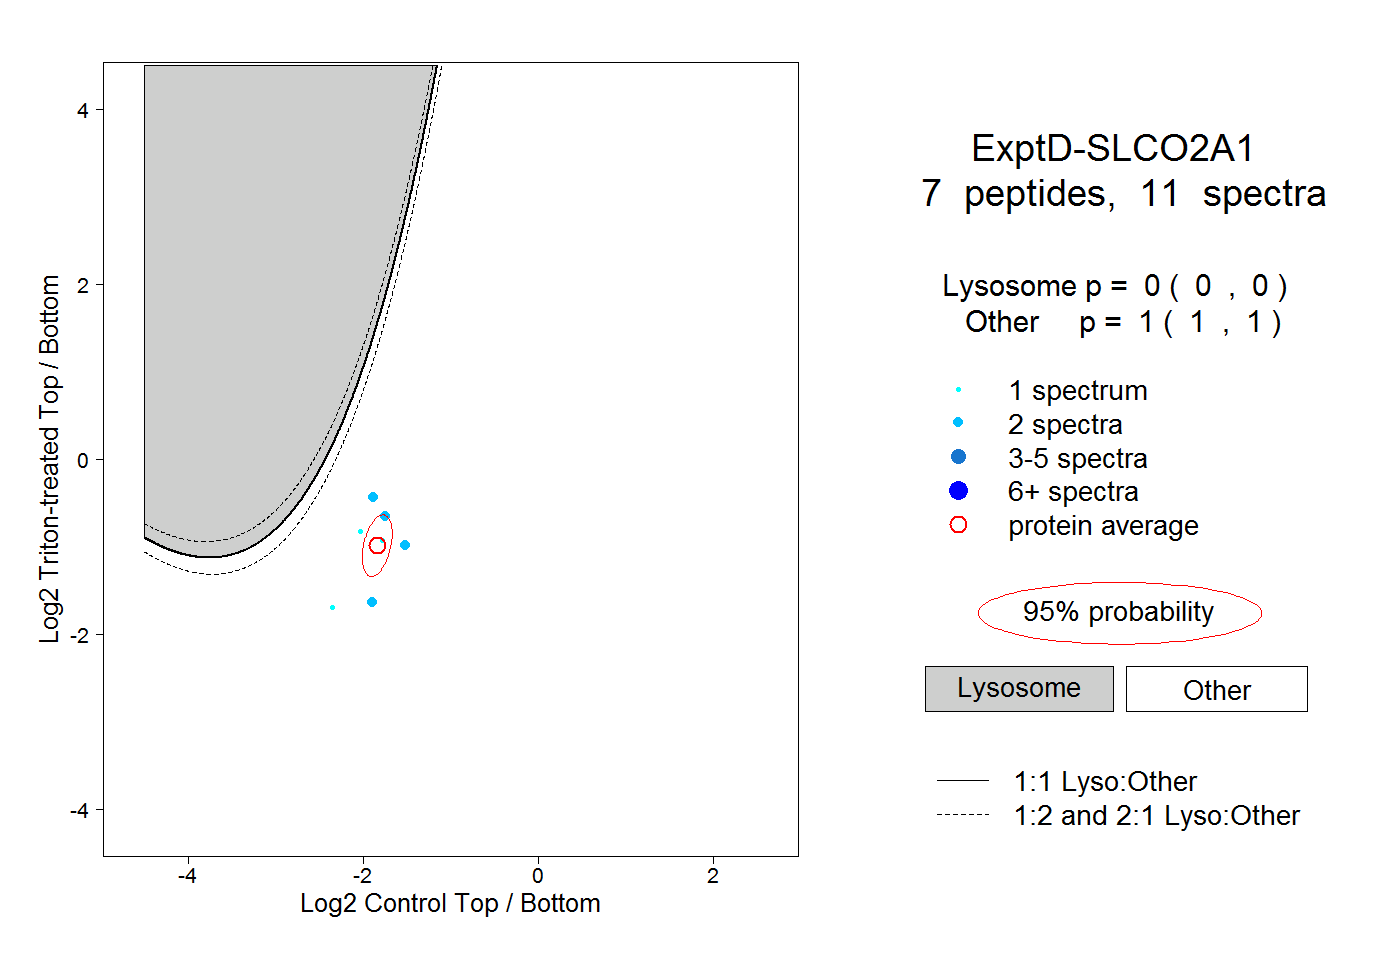
| Expt D |
7
peptides |
11
spectra |
 |
|
0.000
0.000 | 0.000 |
|
|
|
|
|
|
|
1.000
1.000 | 1.000 |