 1
1peptide
spectra
0.000 | 0.000
0.083 | 0.121
0.000 | 0.000
0.756 | 0.821
0.077 | 0.127
0.000 | 0.000
0.000 | 0.000
0.000 | 0.000
1peptide
spectra
0.000 | 0.000
1.000 | 1.000
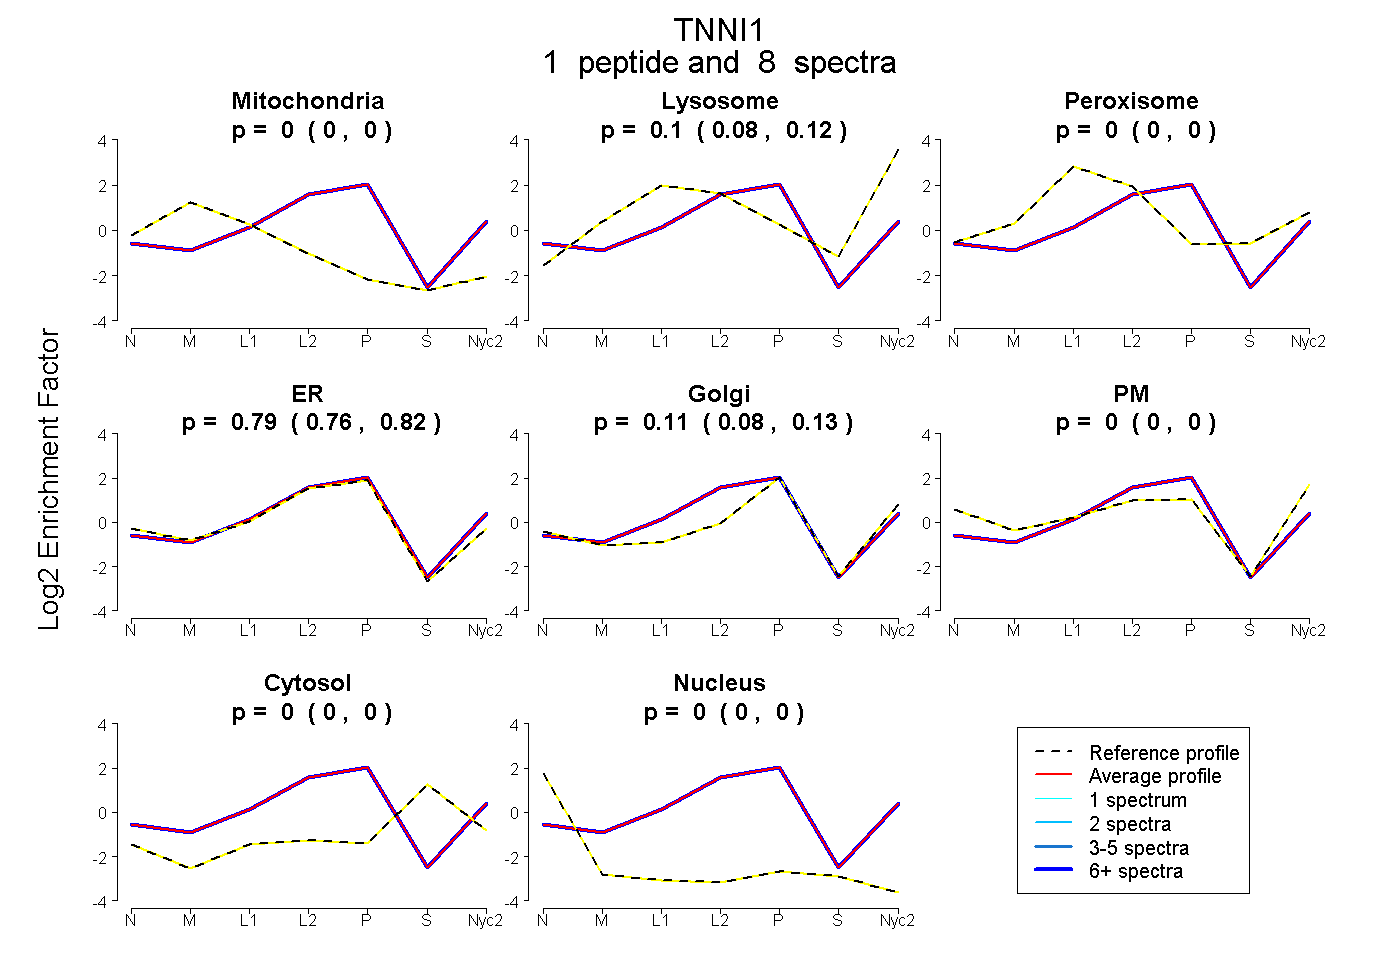
| Plot | Mito | Lyso | Perox | ER | Golgi | PM | Cytosol | Nucleus | |||||
| Expt A |
1 peptide |
8 spectra |
|
0.000 0.000 | 0.000 |
0.102 0.083 | 0.121 |
0.000 0.000 | 0.000 |
0.792 0.756 | 0.821 |
0.105 0.077 | 0.127 |
0.000 0.000 | 0.000 |
0.000 0.000 | 0.000 |
0.000 0.000 | 0.000 |
||
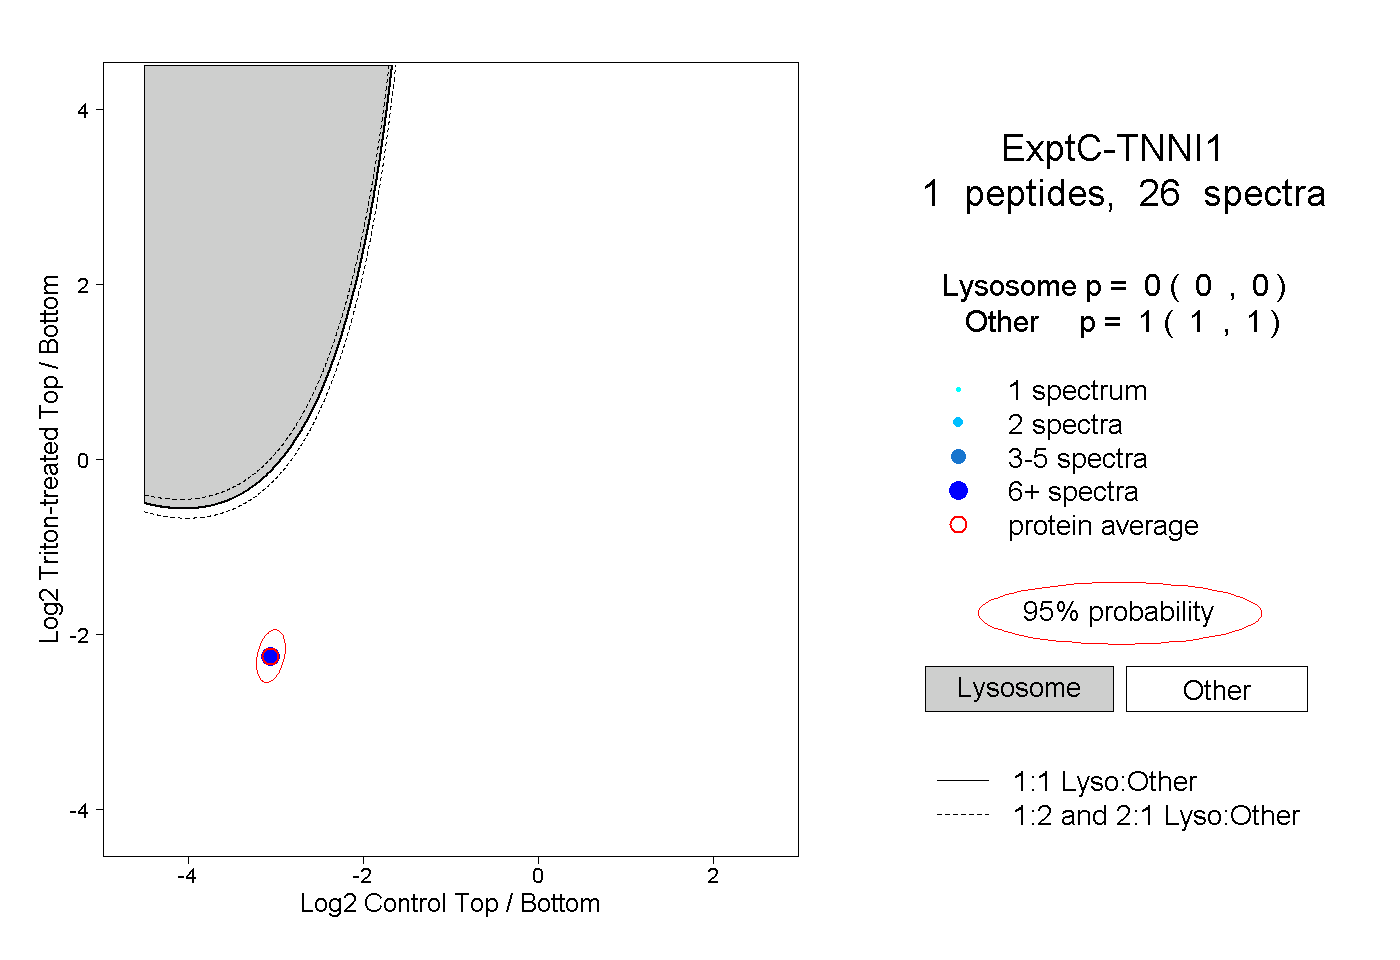
| Plot | Lyso | Other | |||||||||||
| Expt C |
1 peptide |
26 spectra |
|
0.000 0.000 | 0.000 |
1.000 1.000 | 1.000 |