 7
7peptides
spectra
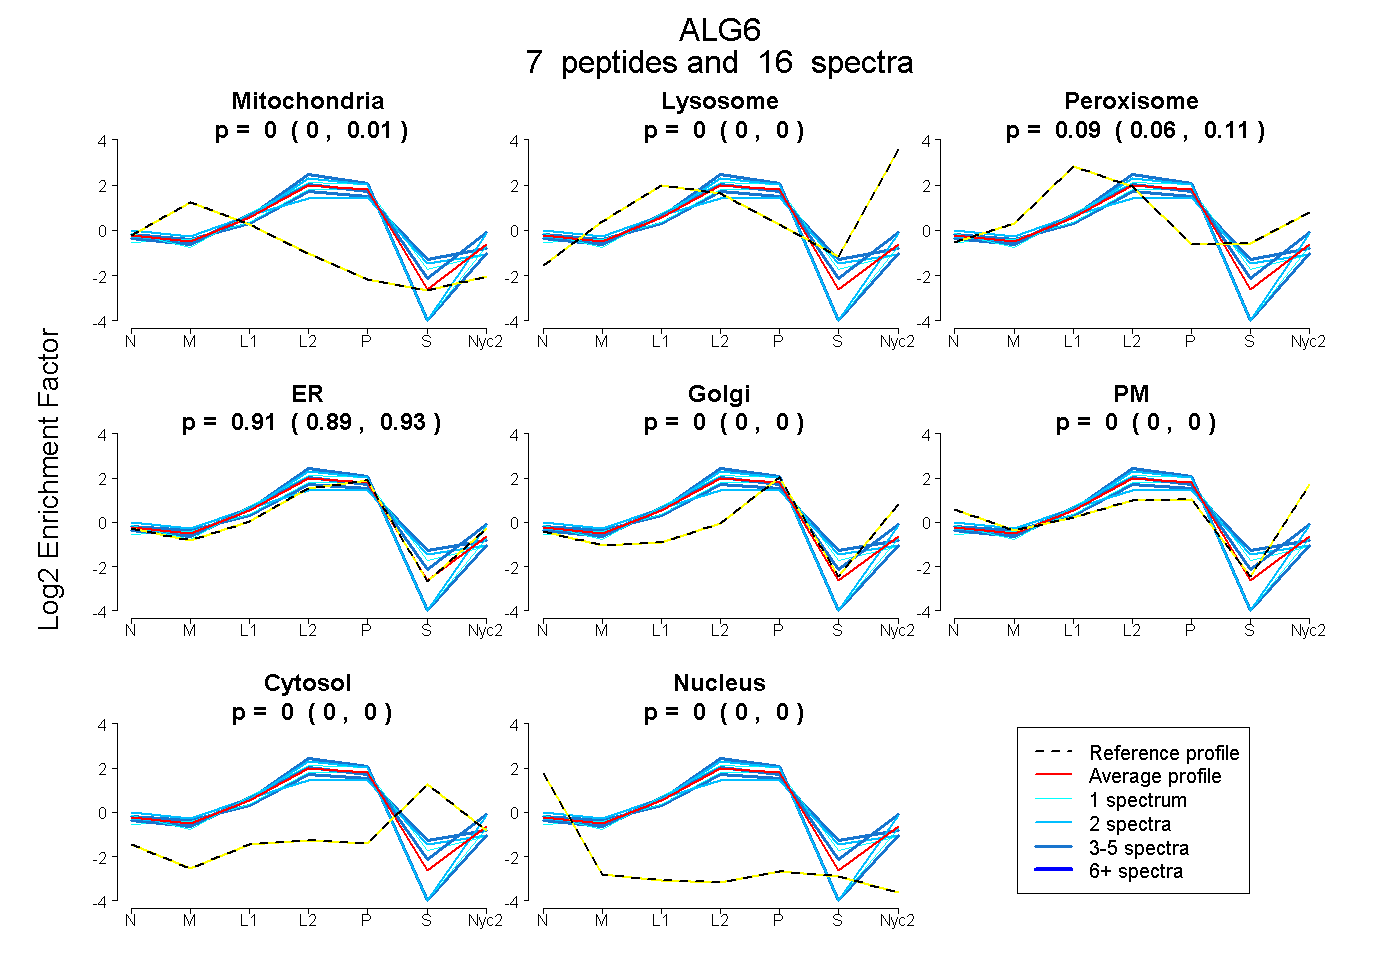
0.000 | 0.006
0.000 | 0.000
0.060 | 0.107
0.887 | 0.933
0.000 | 0.000
0.000 | 0.000
0.000 | 0.000
0.000 | 0.000
3peptides
spectra
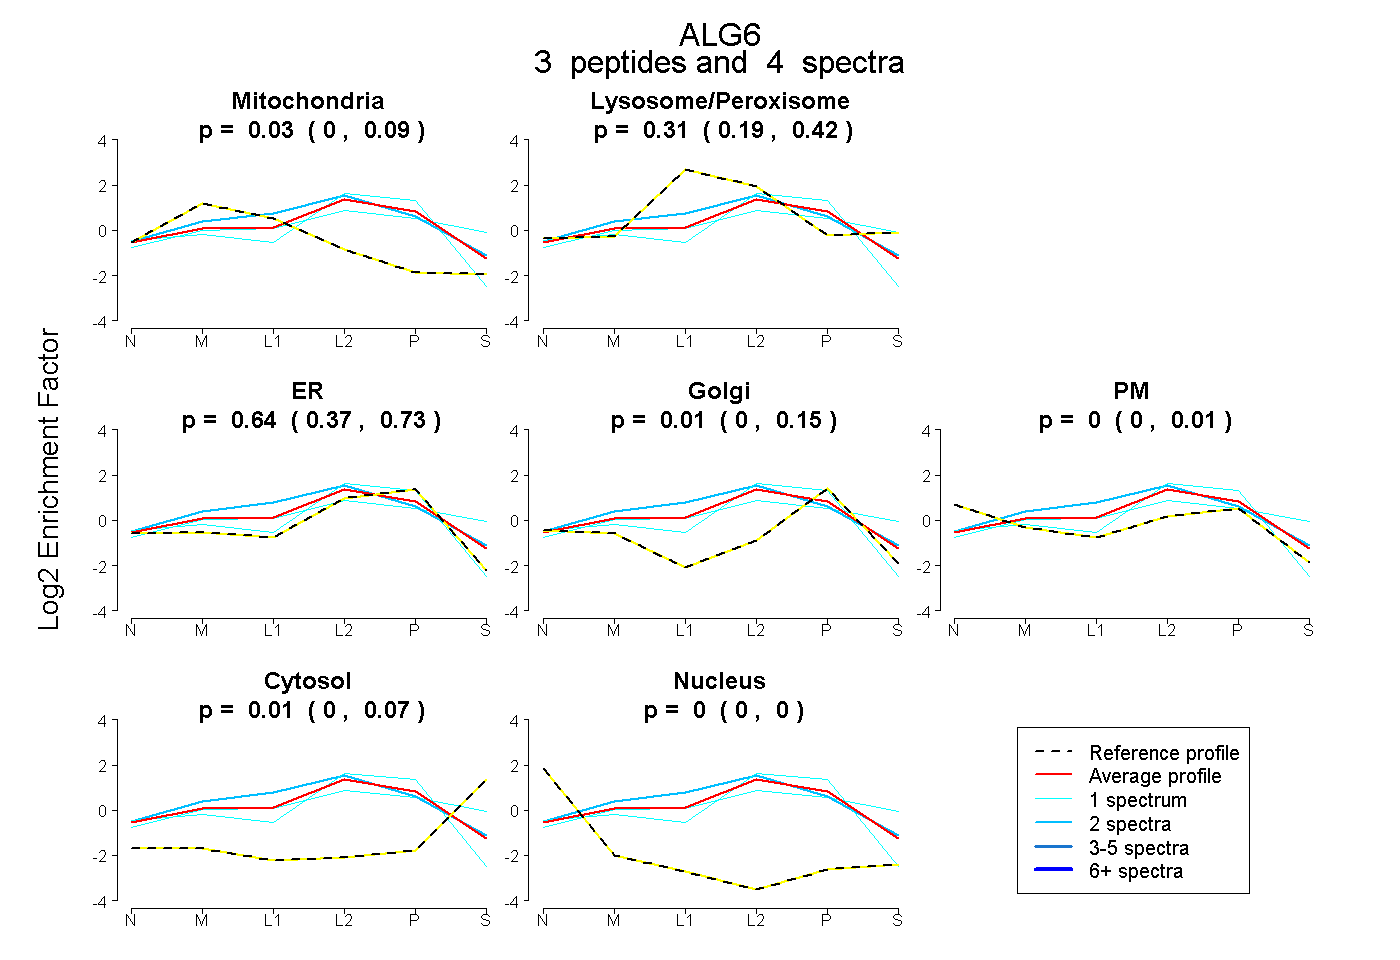
0.000 | 0.094
0.194 | 0.424
0.373 | 0.727
0.000 | 0.152
0.000 | 0.008
0.000 | 0.068
0.000 | 0.000
7peptides
spectra
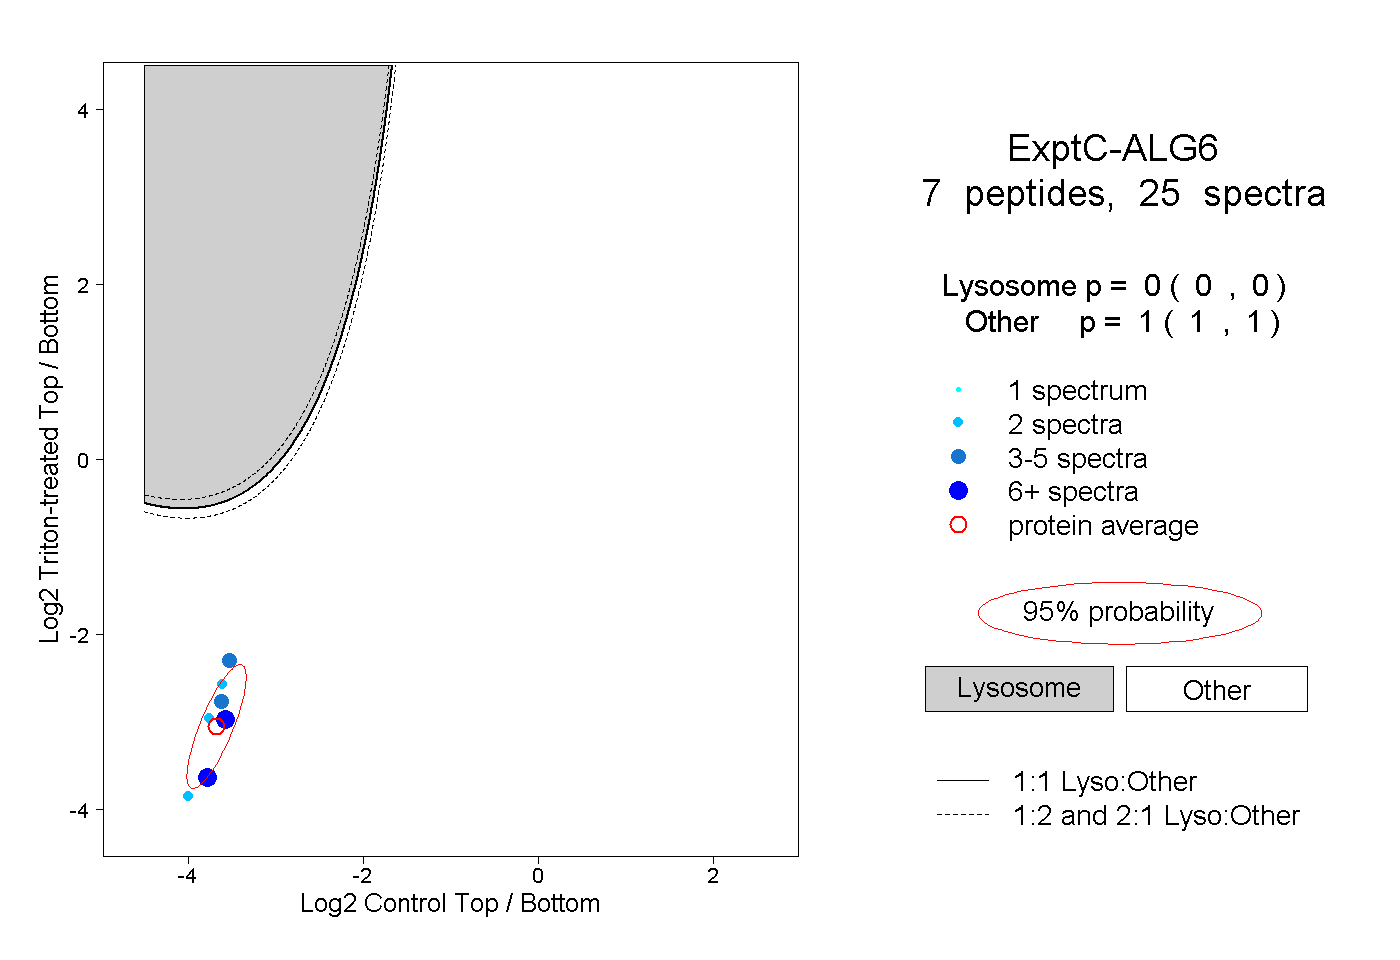
0.000 | 0.000
1.000 | 1.000
2peptides
spectra
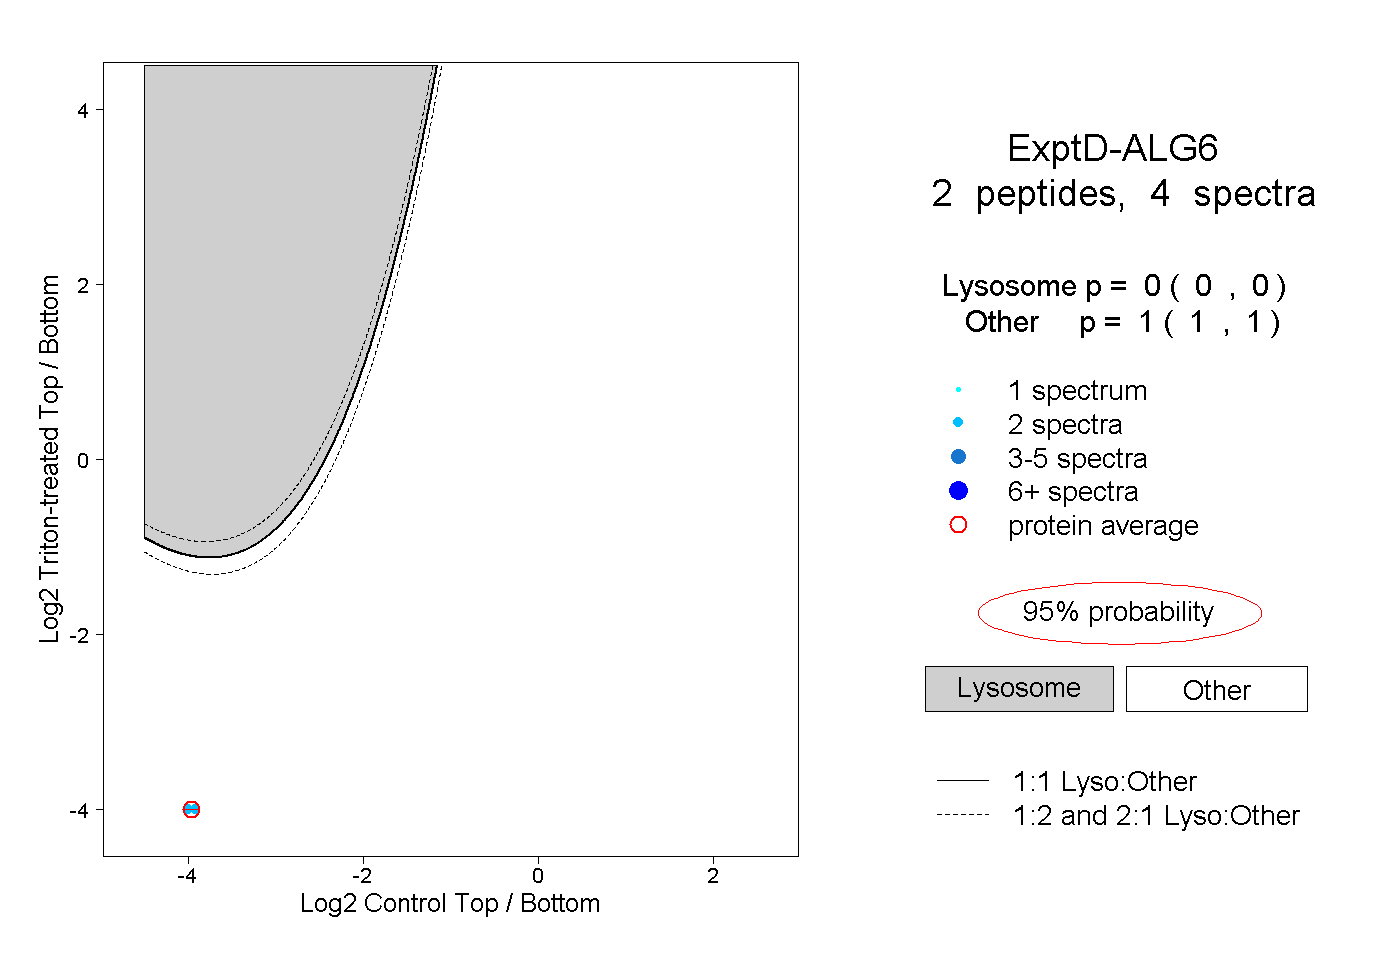
0.000 | 0.000
1.000 | 1.000