 13
13peptides
spectra

0.000 | 0.000
0.000 | 0.000
0.000 | 0.000
0.959 | 0.968
0.023 | 0.032
0.000 | 0.008
0.000 | 0.000
0.003 | 0.005
10peptides
spectra
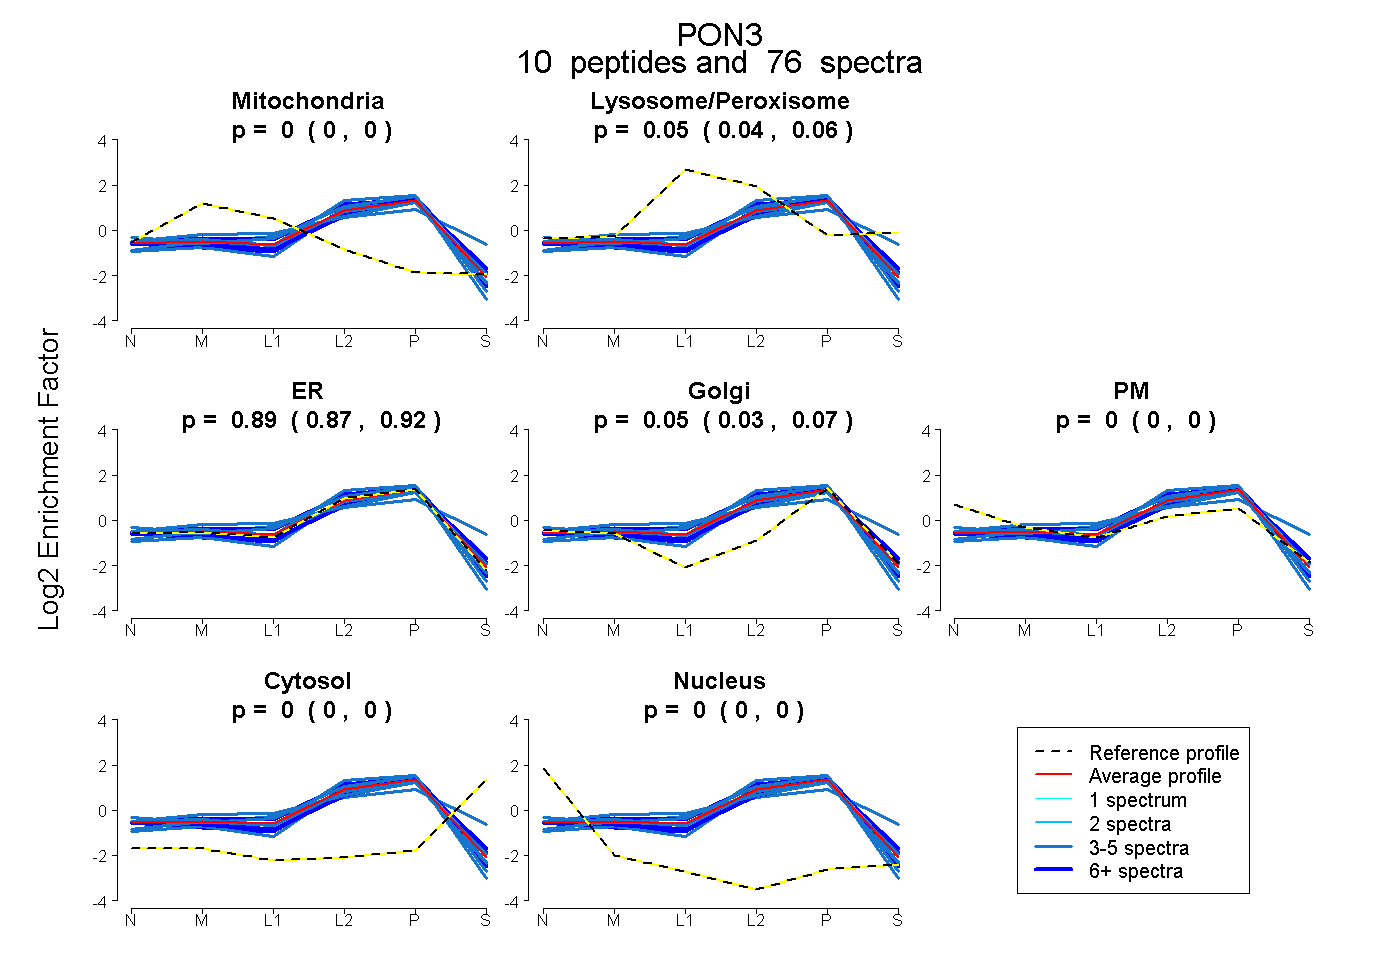
0.000 | 0.004
0.039 | 0.060
0.872 | 0.916
0.034 | 0.065
0.000 | 0.000
0.000 | 0.000
0.000 | 0.000

