 13
13peptides
spectra

0.000 | 0.000
0.000 | 0.000
0.000 | 0.000
0.959 | 0.968
0.023 | 0.032
0.000 | 0.008
0.000 | 0.000
0.003 | 0.005
| Plot | Mito | Lyso | Perox | ER | Golgi | PM | Cytosol | Nucleus | |||||
| Expt A |
13 peptides |
128 spectra |
|
0.000 0.000 | 0.000 |
0.000 0.000 | 0.000 |
0.000 0.000 | 0.000 |
0.964 0.959 | 0.968 |
0.027 0.023 | 0.032 |
0.005 0.000 | 0.008 |
0.000 0.000 | 0.000 |
0.004 0.003 | 0.005 |
| 28 spectra, YPGMPSFAPDKPGR | 0.000 | 0.000 | 0.000 | 1.000 | 0.000 | 0.000 | 0.000 | 0.000 | ||
| 6 spectra, LLIYNPEDPPGSEVLR | 0.000 | 0.000 | 0.000 | 0.998 | 0.000 | 0.000 | 0.000 | 0.002 | ||
| 5 spectra, IFLMDLNEPYPK | 0.000 | 0.000 | 0.000 | 0.890 | 0.057 | 0.053 | 0.000 | 0.000 | ||
| 2 spectra, HNNWDLTPVK | 0.000 | 0.000 | 0.000 | 0.983 | 0.000 | 0.000 | 0.000 | 0.017 | ||
| 1 spectrum, ALYCEL | 0.000 | 0.000 | 0.000 | 0.918 | 0.000 | 0.000 | 0.054 | 0.028 | ||
| 9 spectra, NIHIMK | 0.000 | 0.000 | 0.000 | 0.859 | 0.018 | 0.123 | 0.000 | 0.000 | ||
| 13 spectra, IQDPLSDNPR | 0.000 | 0.000 | 0.000 | 0.905 | 0.061 | 0.005 | 0.000 | 0.028 | ||
| 6 spectra, YVYVADVTAK | 0.085 | 0.000 | 0.012 | 0.785 | 0.079 | 0.039 | 0.000 | 0.000 | ||
| 8 spectra, SLVHLK | 0.000 | 0.000 | 0.000 | 0.904 | 0.056 | 0.040 | 0.000 | 0.000 | ||
| 1 spectrum, VVAQGFSSANGITVSLDQK | 0.037 | 0.000 | 0.047 | 0.344 | 0.000 | 0.447 | 0.011 | 0.113 | ||
| 1 spectrum, DNTVYLYAVNHPHMDSTVEIFK | 0.103 | 0.000 | 0.000 | 0.264 | 0.140 | 0.494 | 0.000 | 0.000 | ||
| 44 spectra, MLIGTIFHK | 0.000 | 0.000 | 0.000 | 1.000 | 0.000 | 0.000 | 0.000 | 0.000 | ||
| 4 spectra, FEEQPR | 0.000 | 0.011 | 0.000 | 0.879 | 0.054 | 0.009 | 0.046 | 0.000 |
| Plot | Mito | Lyso or Perox | ER | Golgi | PM | Cytosol | Nucleus | ||||||
| Expt B |
10 peptides |
76 spectra |
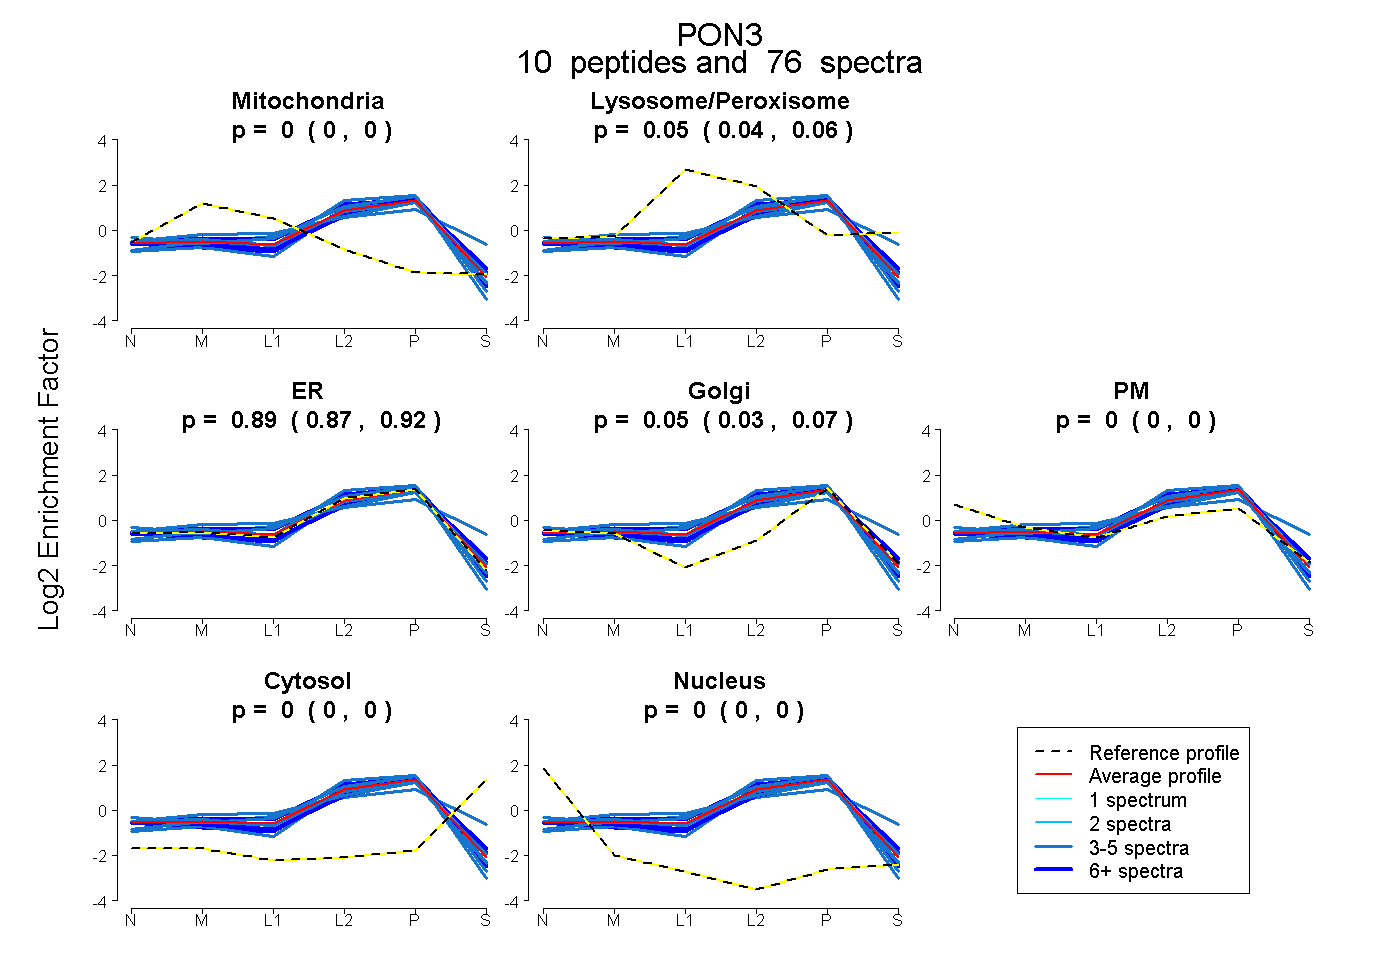 |
0.000 0.000 | 0.004 |
0.052 0.039 | 0.060 |
0.894 0.872 | 0.916 |
0.054 0.034 | 0.065 |
0.000 0.000 | 0.000 |
0.000 0.000 | 0.000 |
0.000 0.000 | 0.000 |
|||
| Plot | Lyso | Other | |||||||||||
| Expt C |
9 peptides |
155 spectra |
 |
0.000 0.000 | 0.000 |
1.000 1.000 | 1.000 |
||||||||
| Plot | Lyso | Other | |||||||||||
| Expt D |
6 peptides |
13 spectra |
 |
0.000 0.000 | 0.000 |
1.000 1.000 | 1.000 |