 10
10peptides
spectra
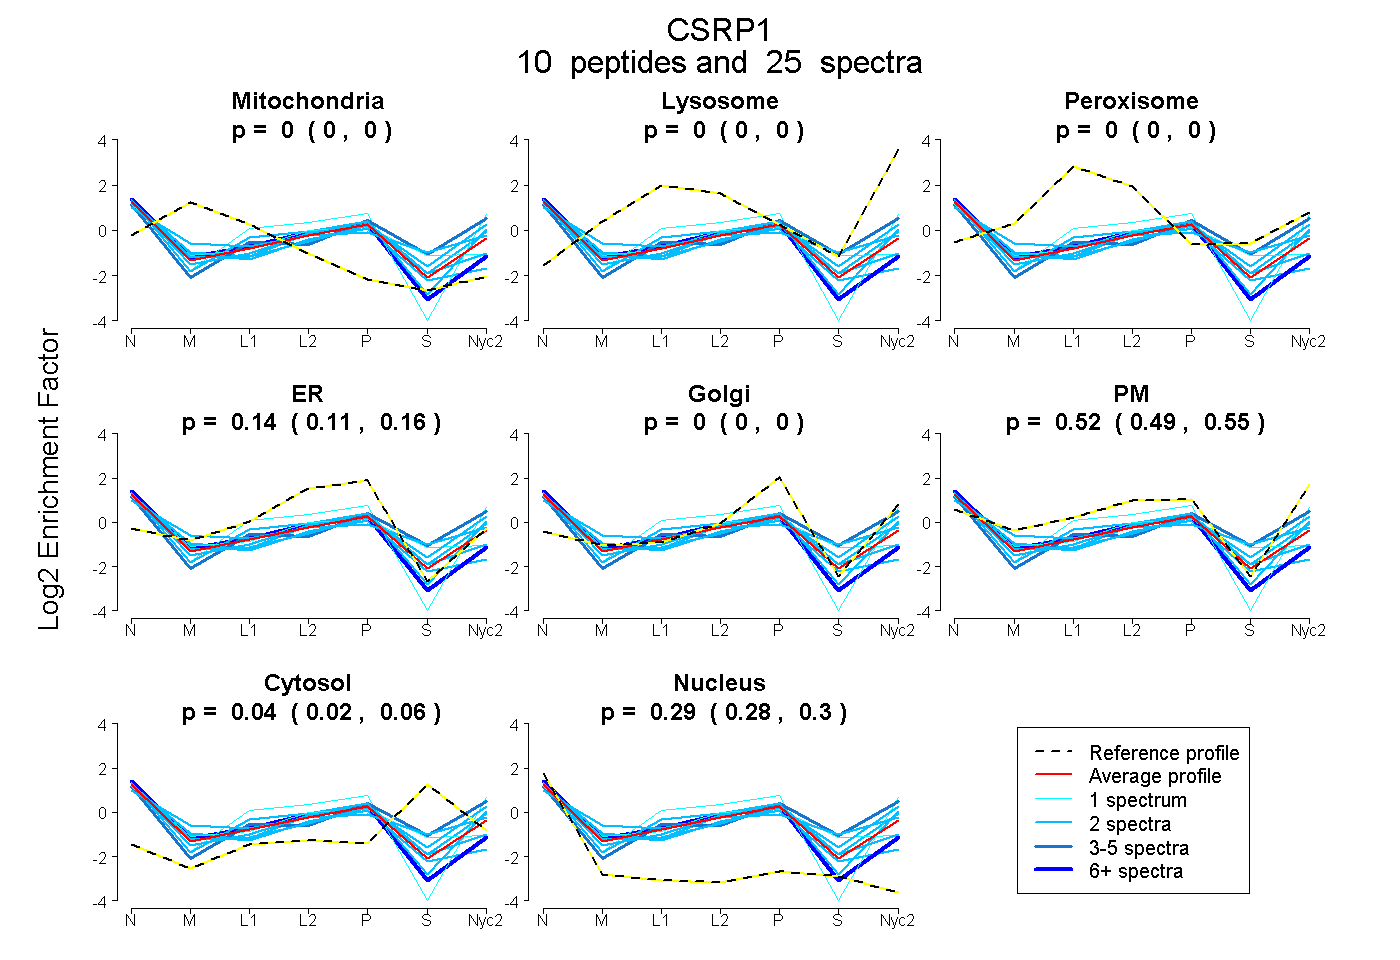
0.000 | 0.000
0.000 | 0.000
0.000 | 0.005
0.110 | 0.162
0.000 | 0.000
0.490 | 0.553
0.022 | 0.058
0.282 | 0.302
2peptides
spectra
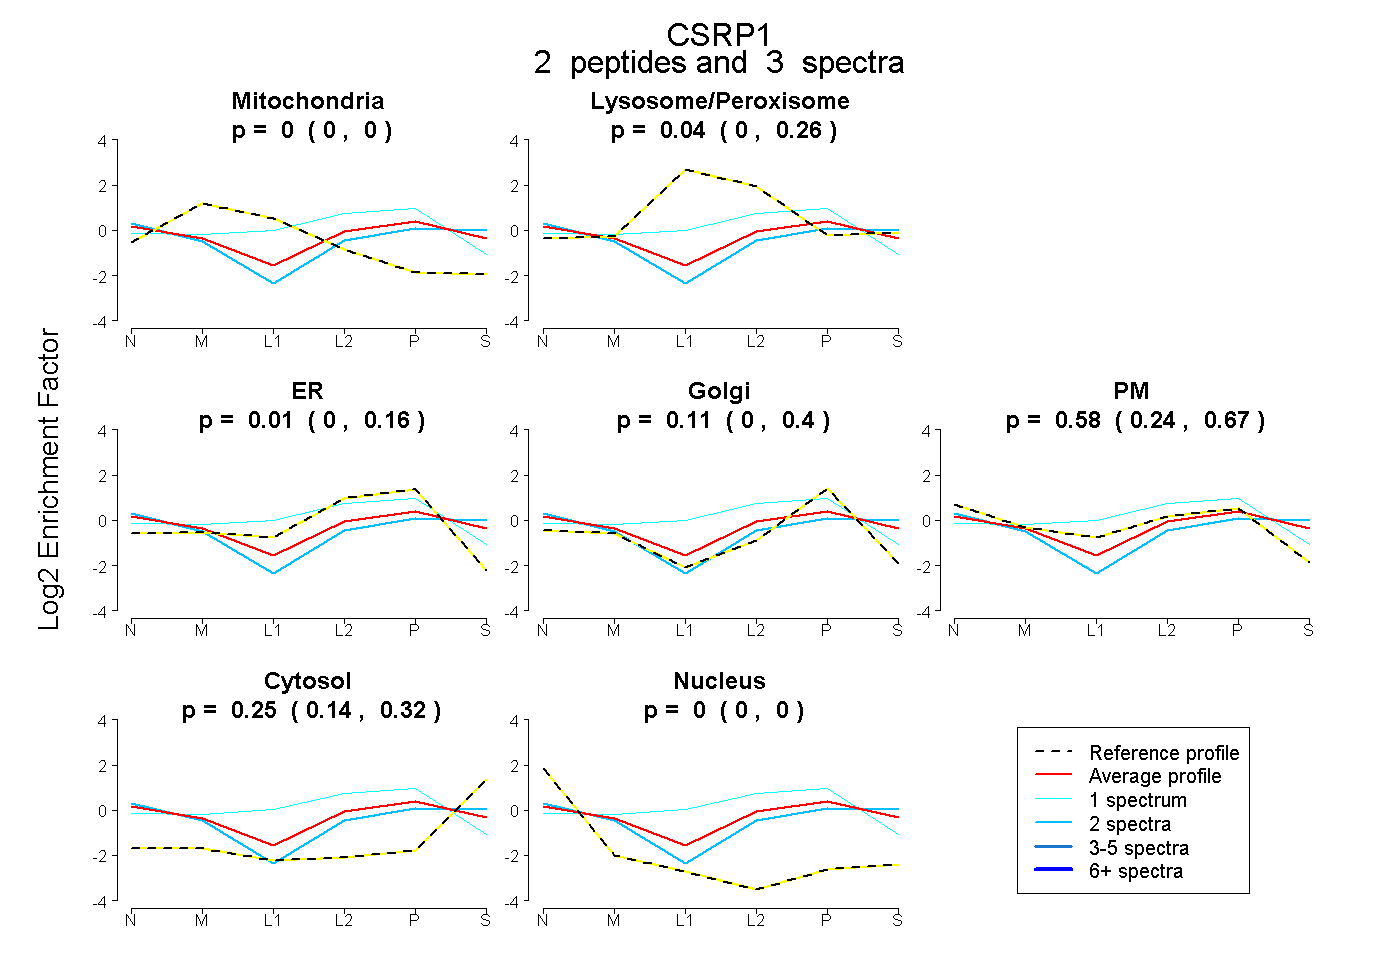
0.000 | 0.000
0.000 | 0.262
0.000 | 0.159
0.000 | 0.402
0.244 | 0.665
0.138 | 0.323
0.000 | 0.000
12peptides
spectra
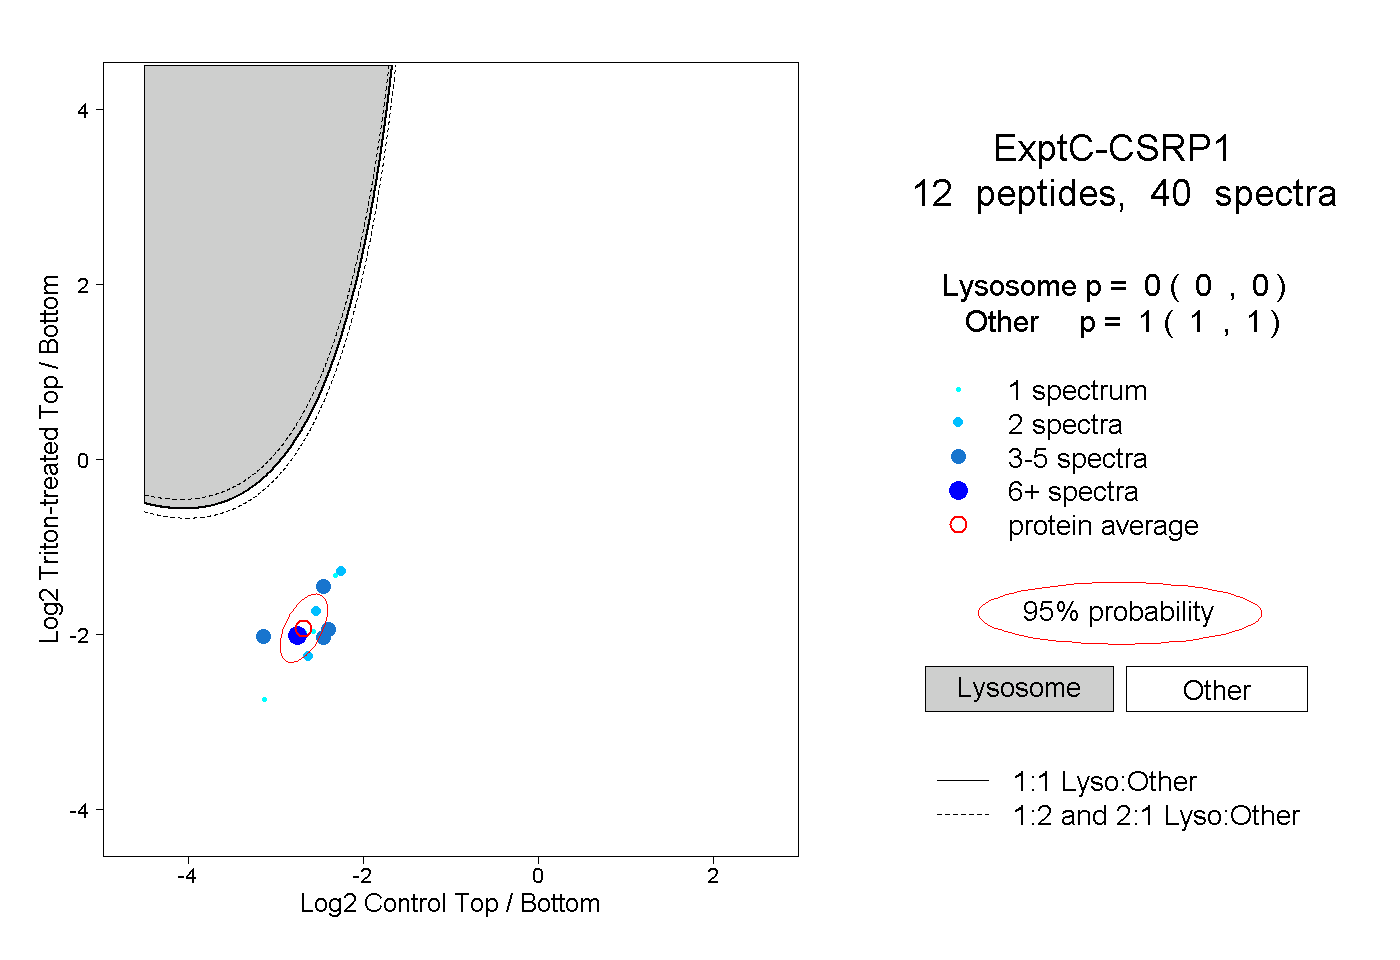
0.000 | 0.000
1.000 | 1.000
2peptides
spectra
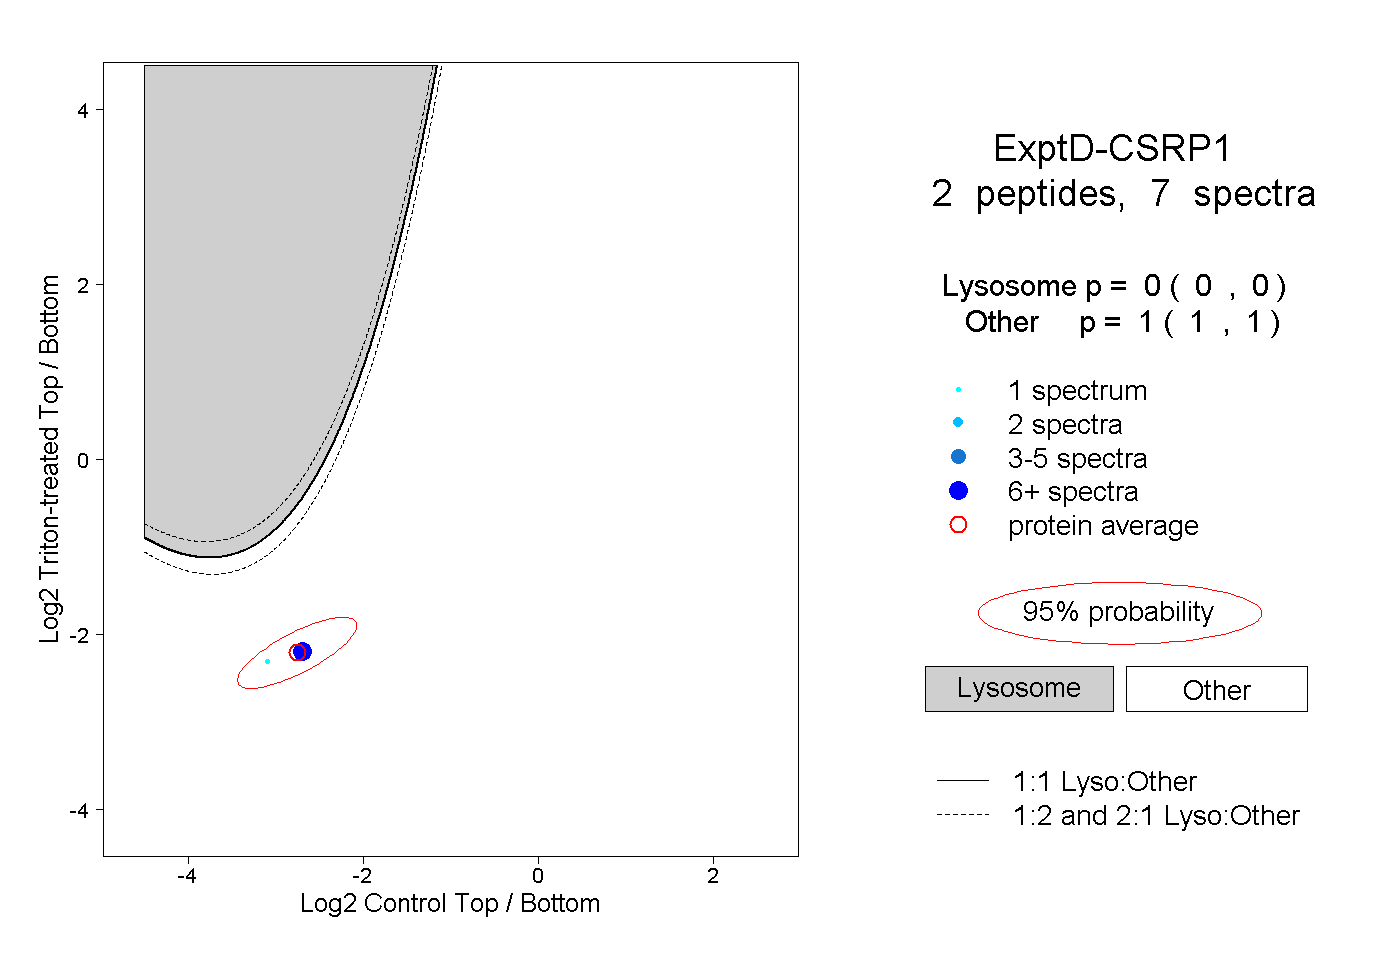
0.000 | 0.000
1.000 | 1.000