6
6peptides
spectra
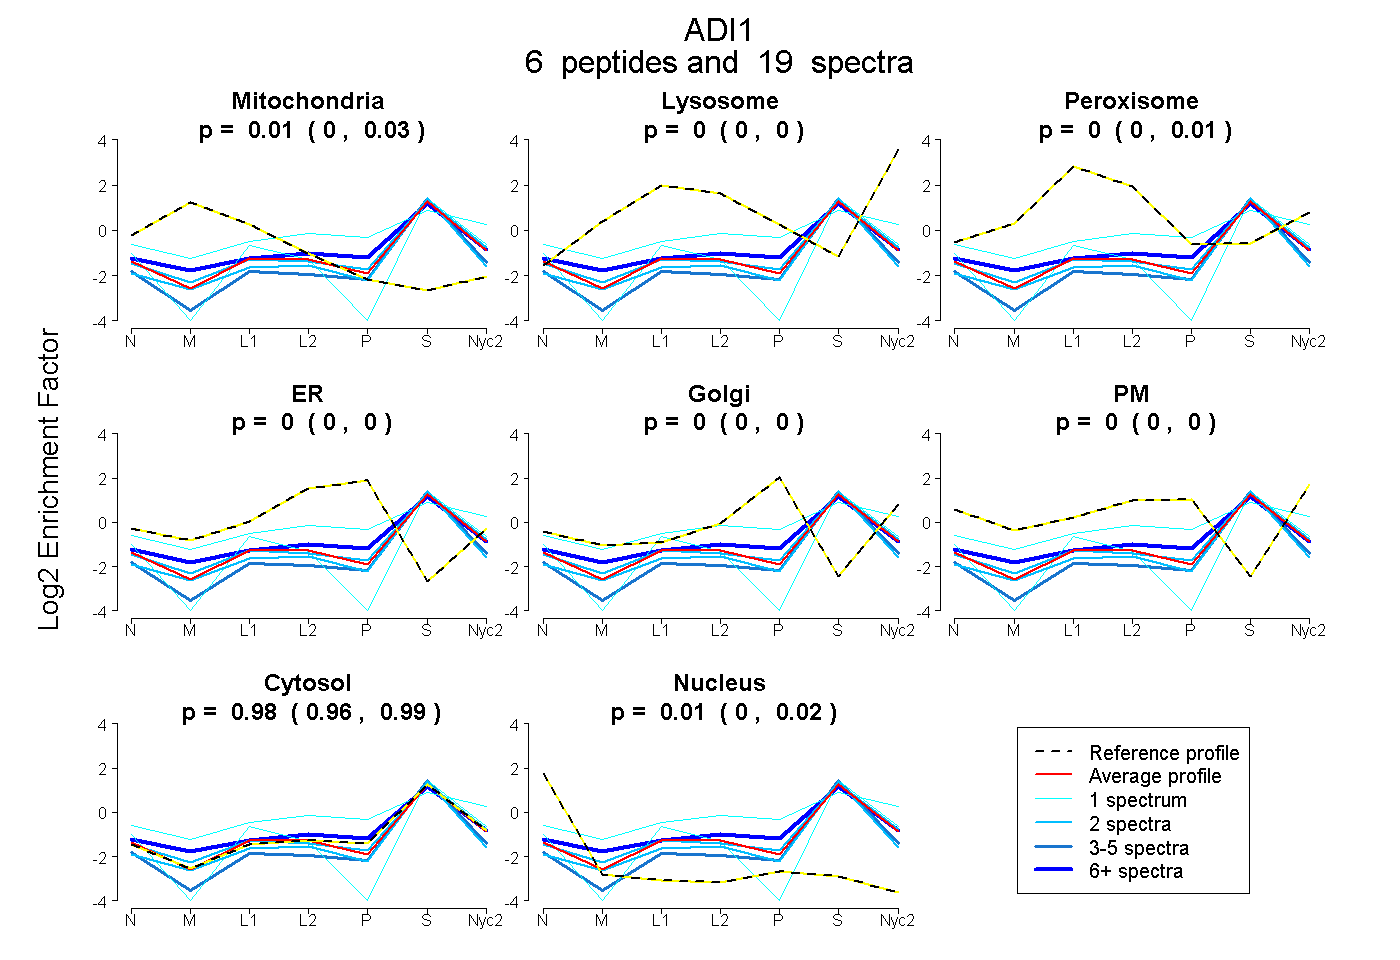
0.000 | 0.034
0.000 | 0.000
0.000 | 0.014
0.000 | 0.000
0.000 | 0.000
0.000 | 0.000
0.958 | 0.988
0.000 | 0.023
3peptides
spectra
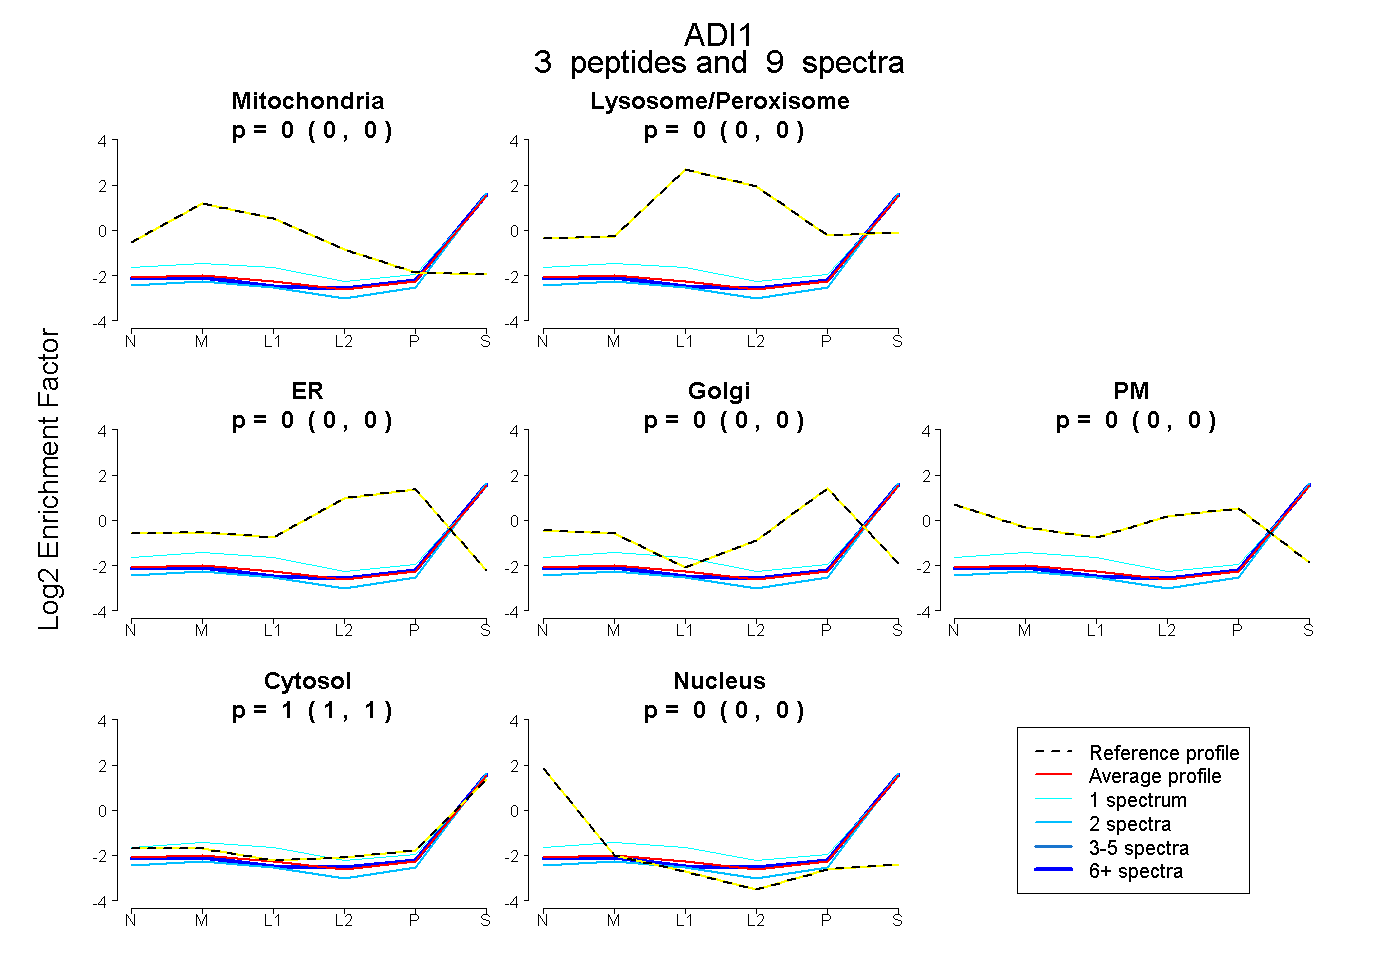
0.000 | 0.000
0.000 | 0.000
0.000 | 0.000
0.000 | 0.000
0.000 | 0.000
1.000 | 1.000
0.000 | 0.000