 6
6peptides
spectra
0.000 | 0.034
0.000 | 0.000
0.000 | 0.014
0.000 | 0.000
0.000 | 0.000
0.000 | 0.000
0.958 | 0.988
0.000 | 0.023
| Plot | Mito | Lyso | Perox | ER | Golgi | PM | Cytosol | Nucleus | |||||
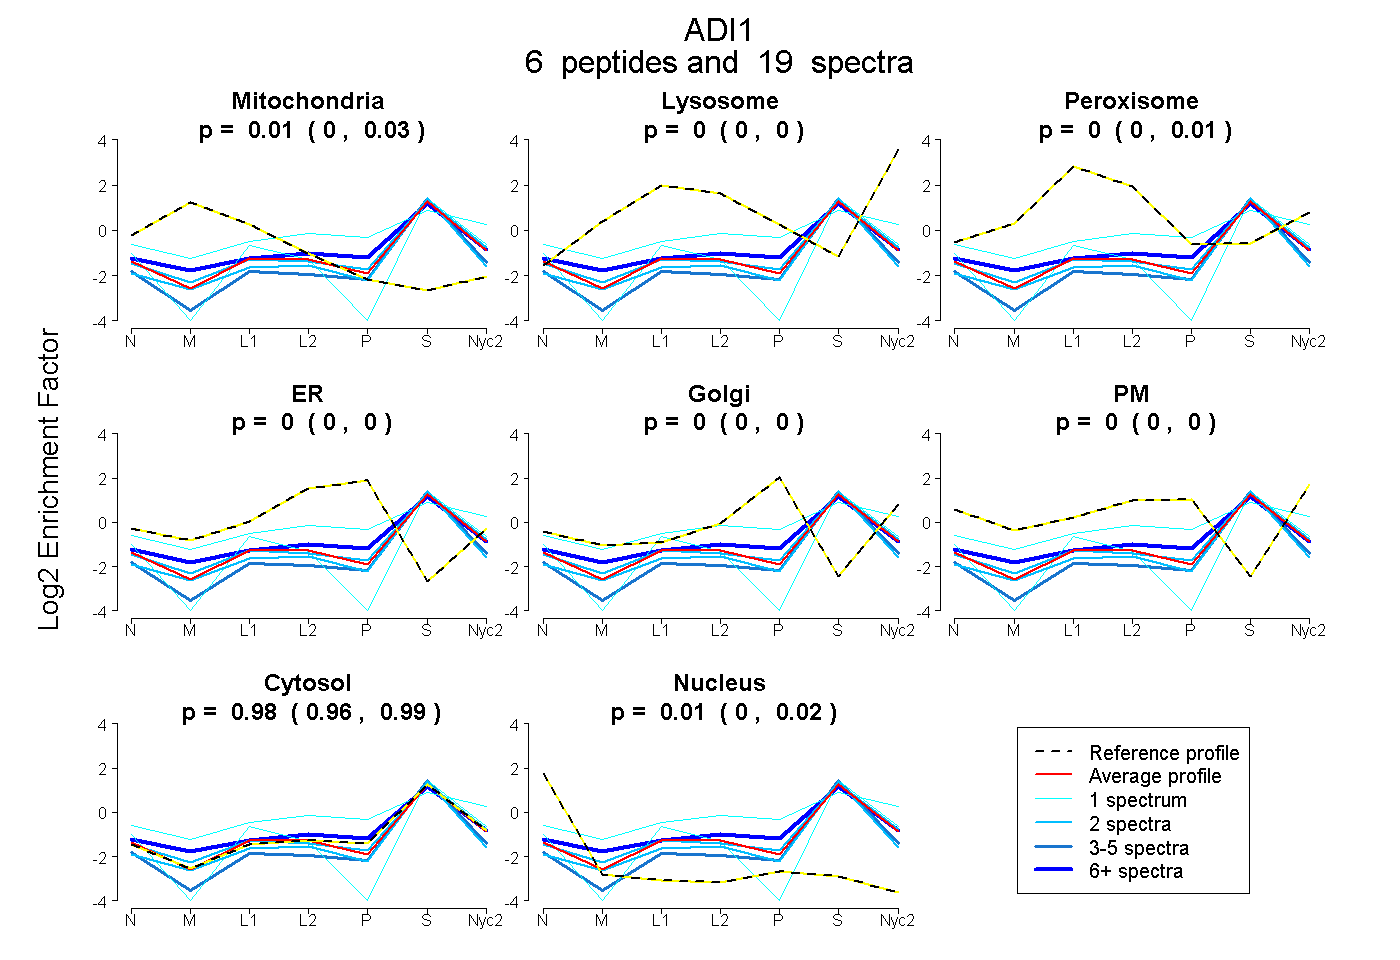
| Expt A |
6 peptides |
19 spectra |
|
0.014 0.000 | 0.034 |
0.000 0.000 | 0.000 |
0.000 0.000 | 0.014 |
0.000 0.000 | 0.000 |
0.000 0.000 | 0.000 |
0.000 0.000 | 0.000 |
0.977 0.958 | 0.988 |
0.008 0.000 | 0.023 |
| 2 spectra, NYSWMDIITICK | 0.000 | 0.000 | 0.000 | 0.000 | 0.000 | 0.000 | 0.956 | 0.044 | ||
| 2 spectra, TLGVLYWK | 0.032 | 0.000 | 0.000 | 0.000 | 0.000 | 0.000 | 0.968 | 0.000 | ||
| 1 spectrum, LFVGEPVWTPYNRPADHFDAR | 0.000 | 0.077 | 0.137 | 0.000 | 0.000 | 0.169 | 0.617 | 0.000 | ||
| 1 spectrum, GDMITLPAGIYHR | 0.000 | 0.000 | 0.000 | 0.000 | 0.000 | 0.000 | 0.942 | 0.058 | ||
| 5 spectra, DSLPNYEEK | 0.000 | 0.000 | 0.000 | 0.000 | 0.000 | 0.000 | 0.934 | 0.066 | ||
| 8 spectra, AQPDRPVGLEQLR | 0.055 | 0.000 | 0.061 | 0.000 | 0.008 | 0.000 | 0.876 | 0.000 |
| Plot | Mito | Lyso or Perox | ER | Golgi | PM | Cytosol | Nucleus | ||||||
| Expt B |
3 peptides |
9 spectra |
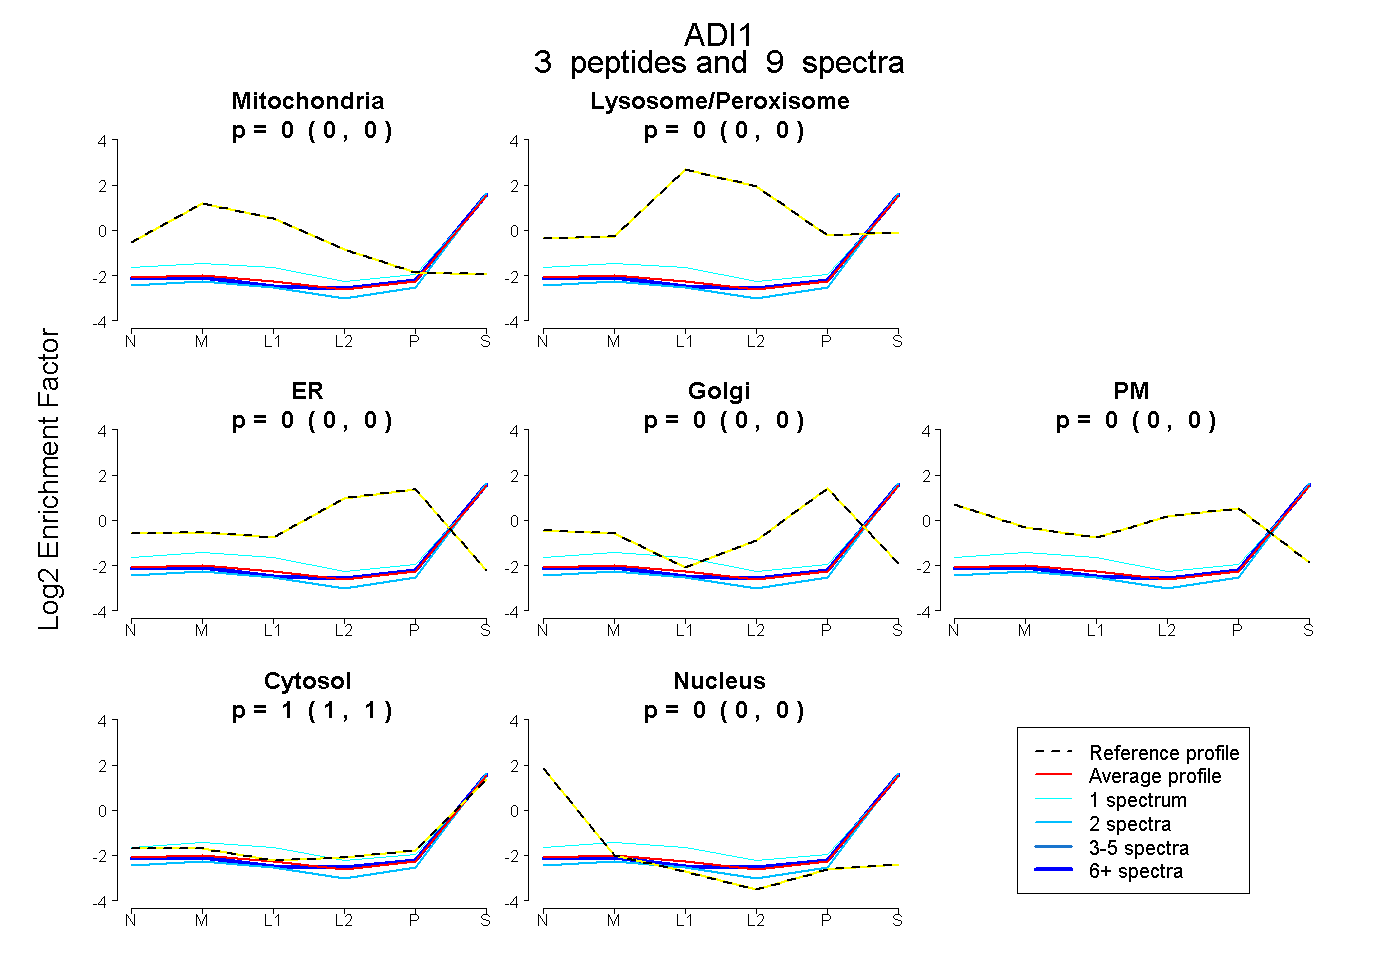 |
0.000 0.000 | 0.000 |
0.000 0.000 | 0.000 |
0.000 0.000 | 0.000 |
0.000 0.000 | 0.000 |
0.000 0.000 | 0.000 |
1.000 1.000 | 1.000 |
0.000 0.000 | 0.000 |
|||
| Plot | Lyso | Other | |||||||||||
| Expt C |
6 peptides |
29 spectra |
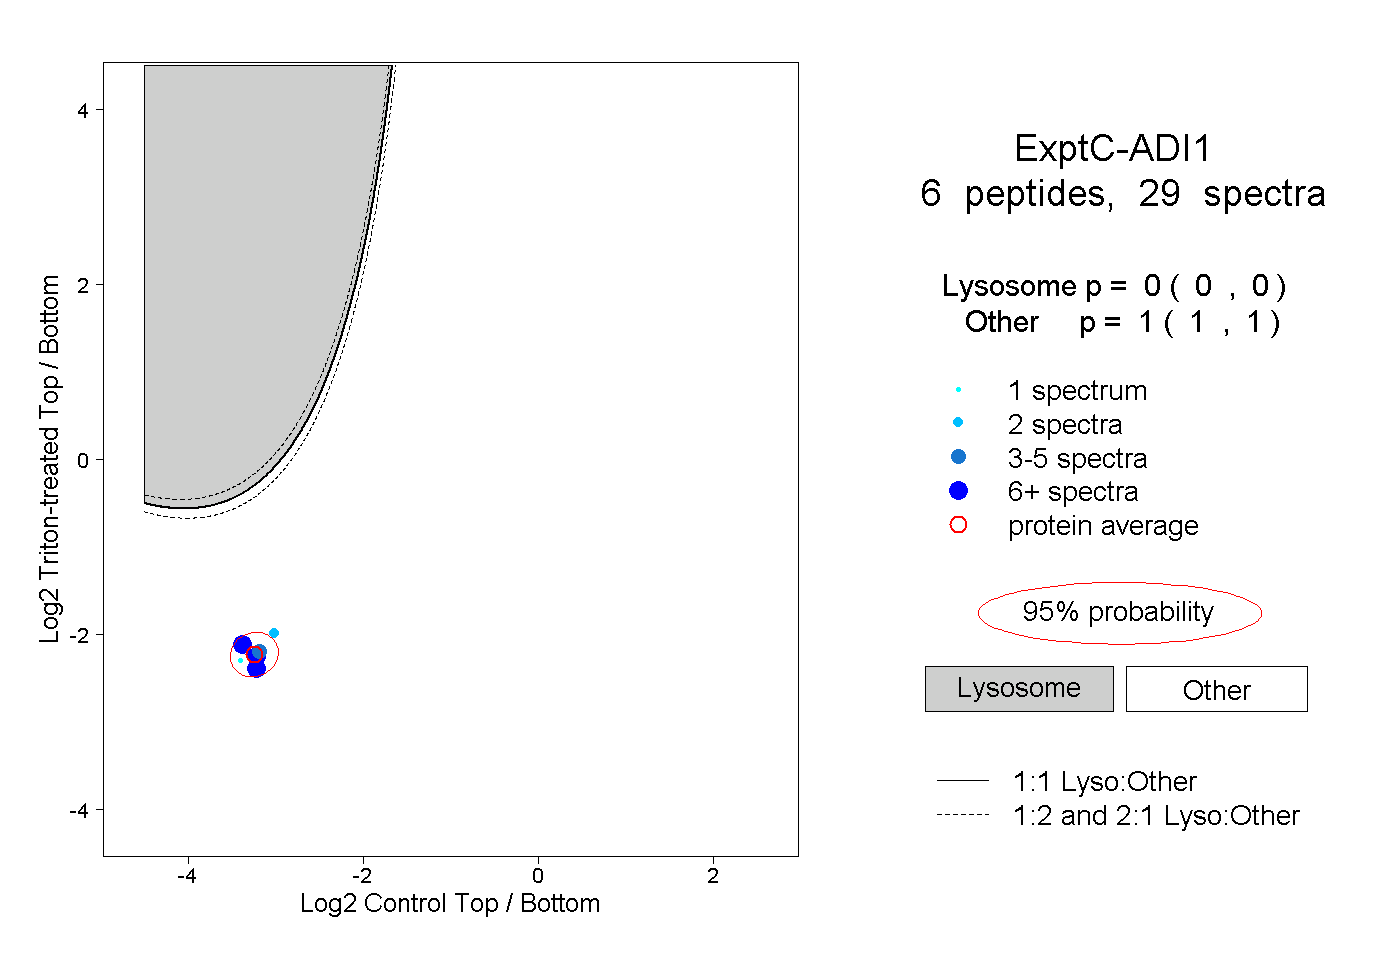 |
0.000 0.000 | 0.000 |
1.000 1.000 | 1.000 |
||||||||
| Plot | Lyso | Other | |||||||||||
| Expt D |
1 peptide |
1 spectrum |
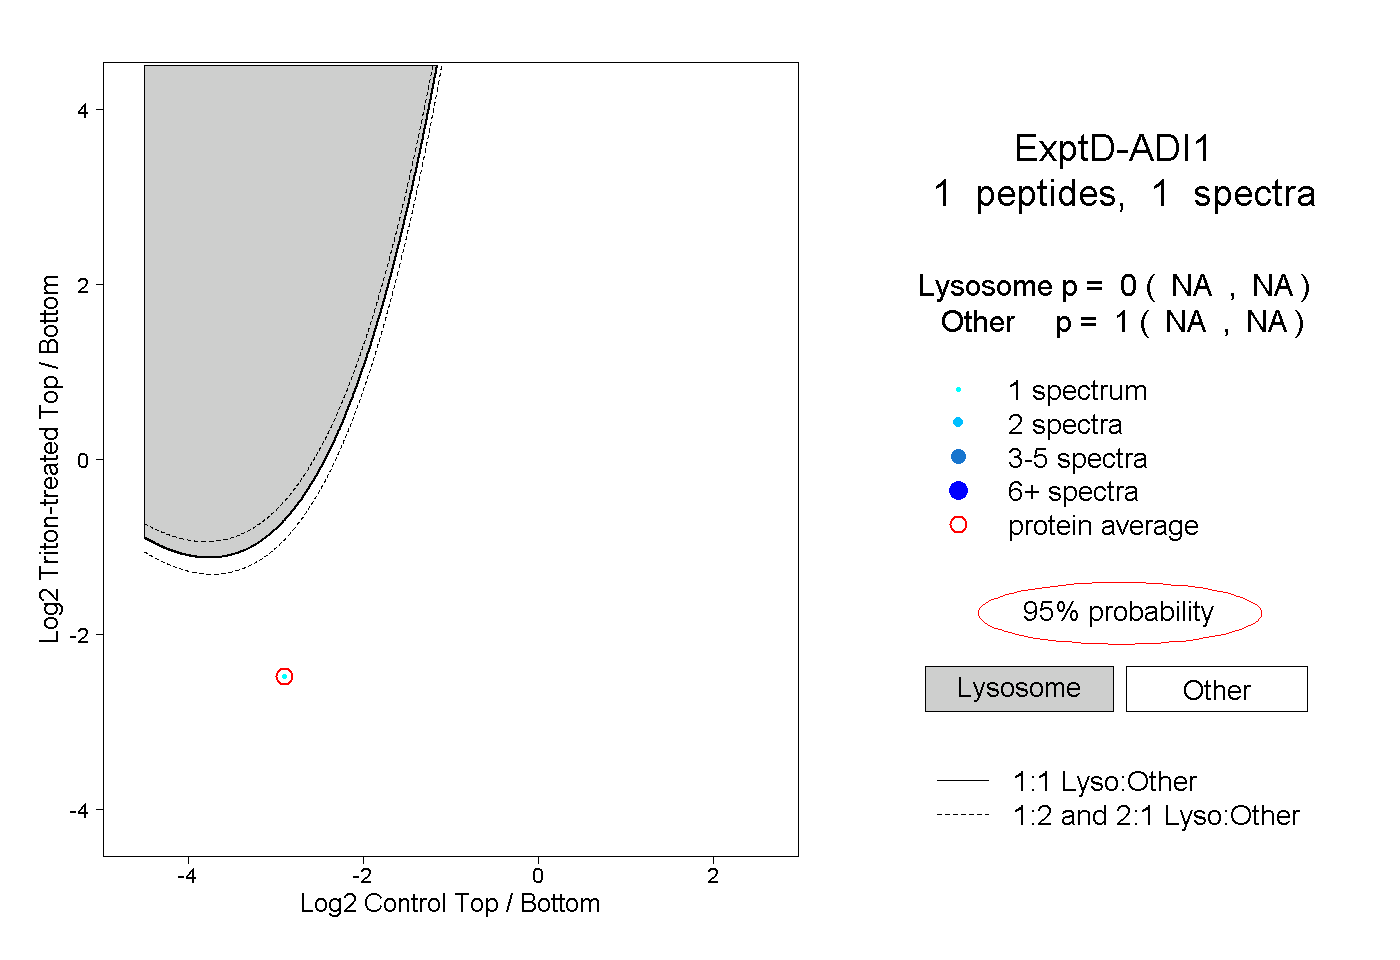 |
0.000 NA | NA |
1.000 NA | NA |