 9
9peptides
spectra
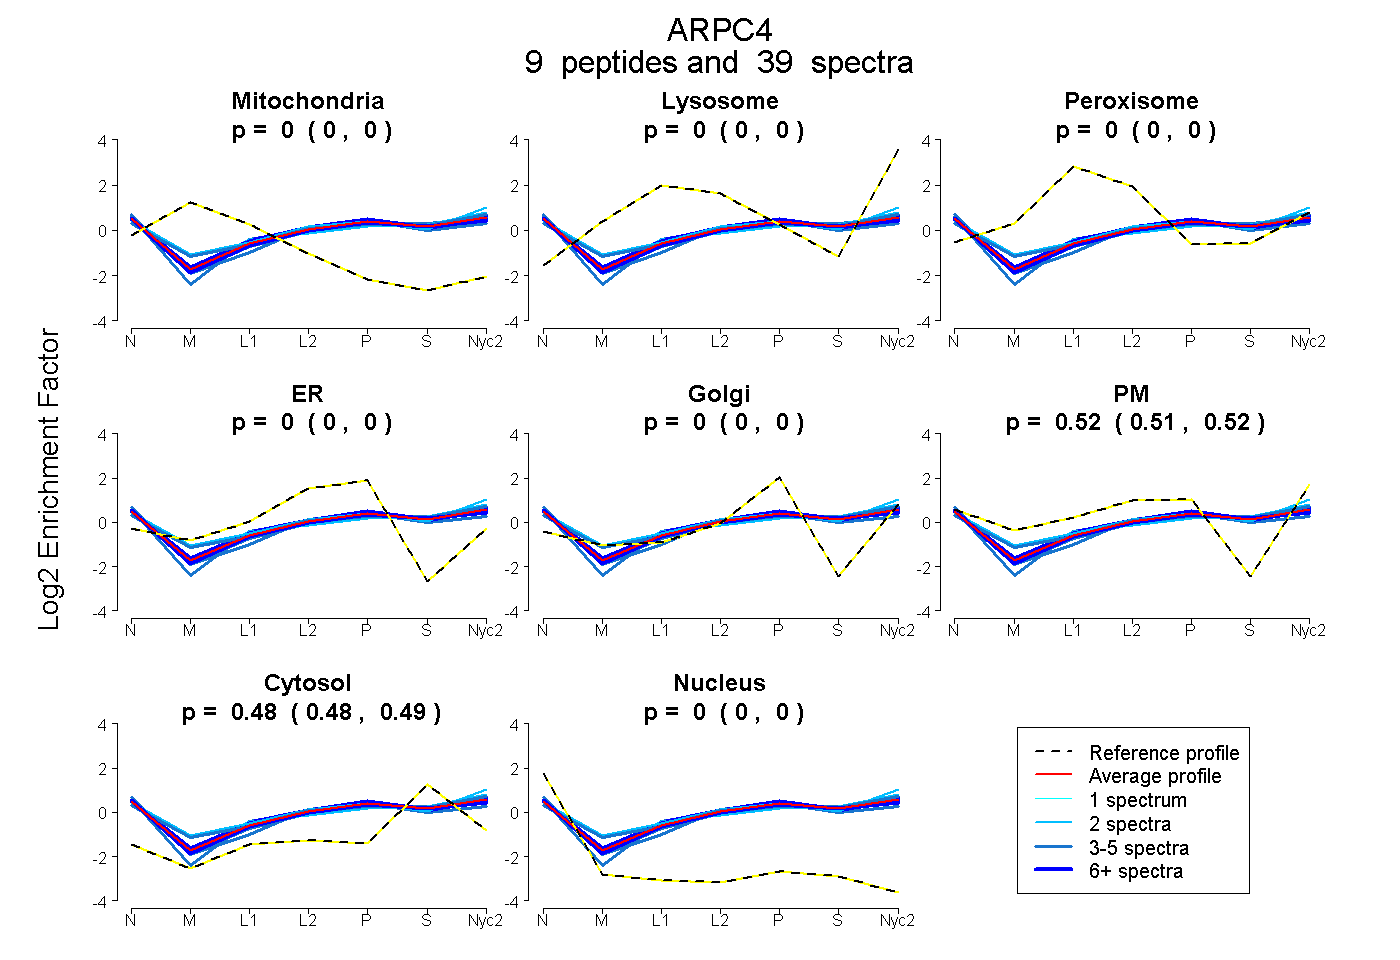
0.000 | 0.000
0.000 | 0.000
0.000 | 0.000
0.000 | 0.000
0.000 | 0.000
0.514 | 0.519
0.481 | 0.486
0.000 | 0.000
6peptides
spectra
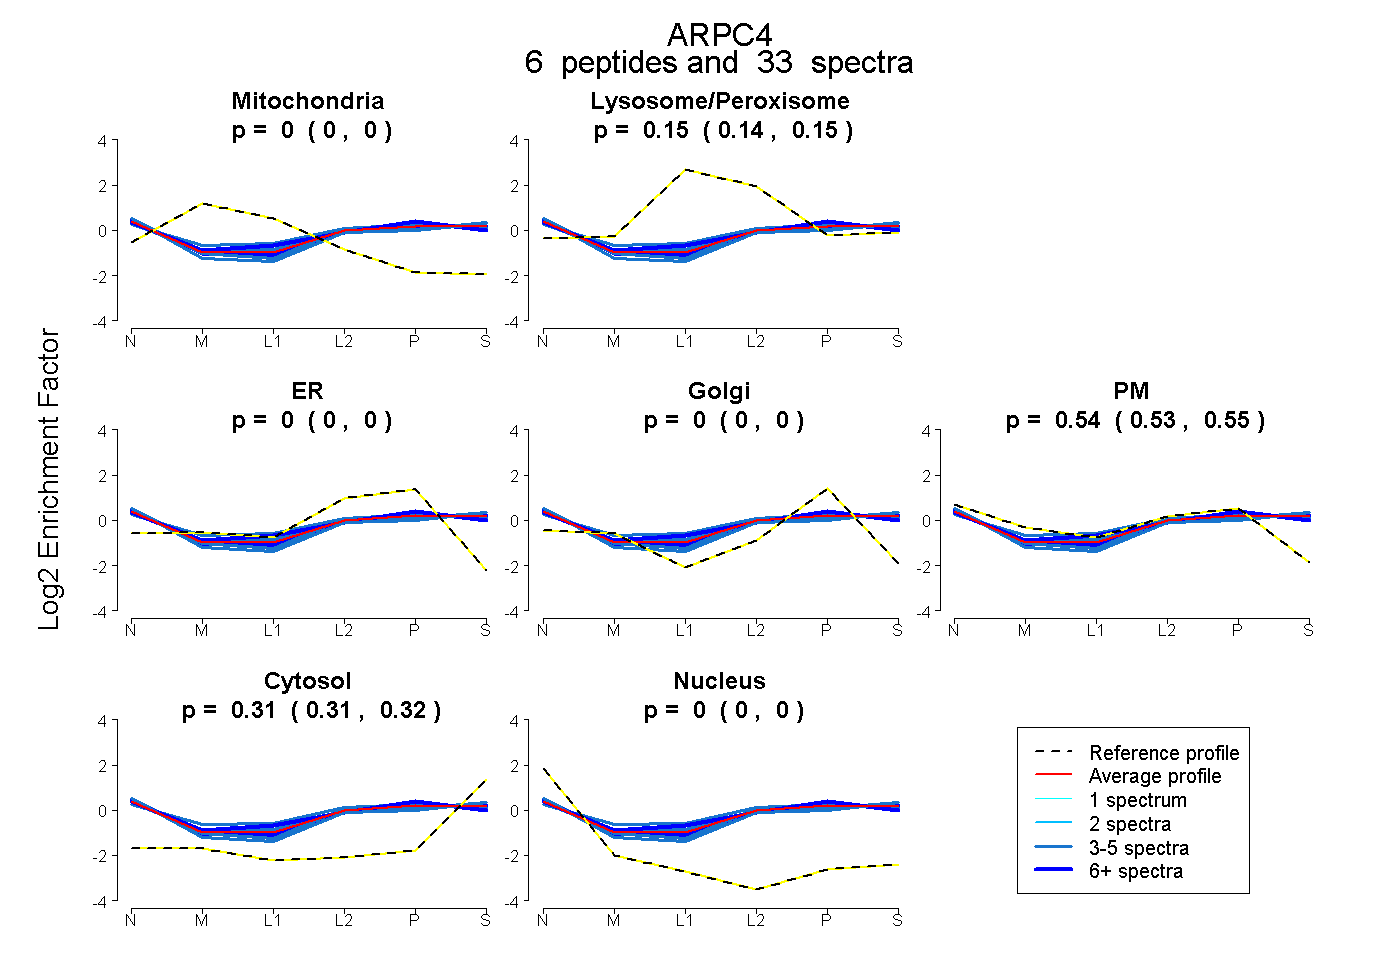
0.000 | 0.000
0.137 | 0.153
0.000 | 0.000
0.000 | 0.000
0.535 | 0.548
0.308 | 0.315
0.000 | 0.000
9peptides
spectra
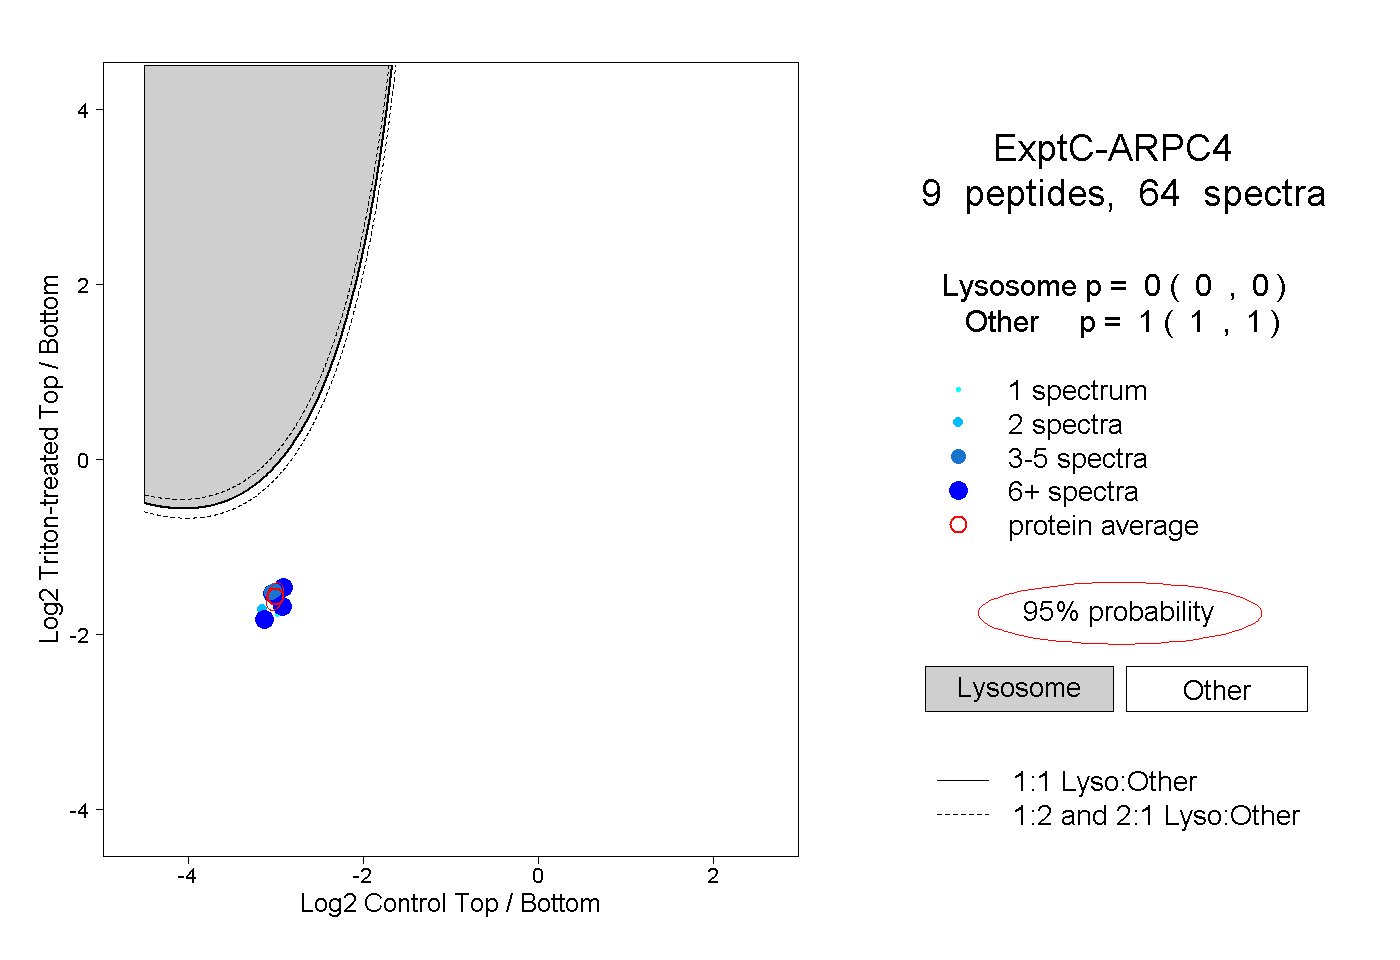
0.000 | 0.000
1.000 | 1.000
4peptides
spectra
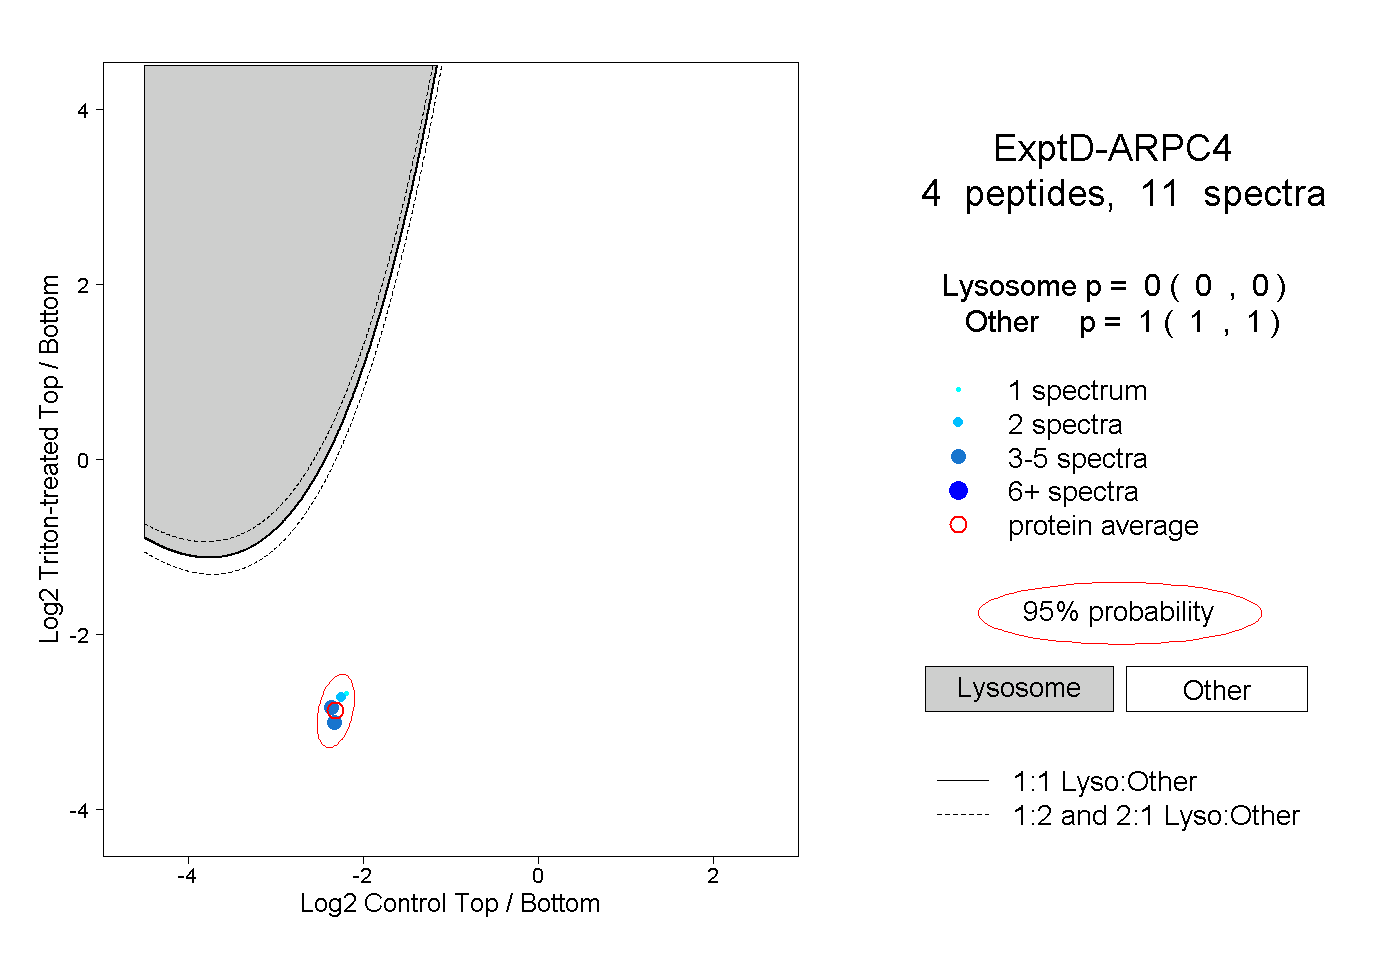
0.000 | 0.000
1.000 | 1.000