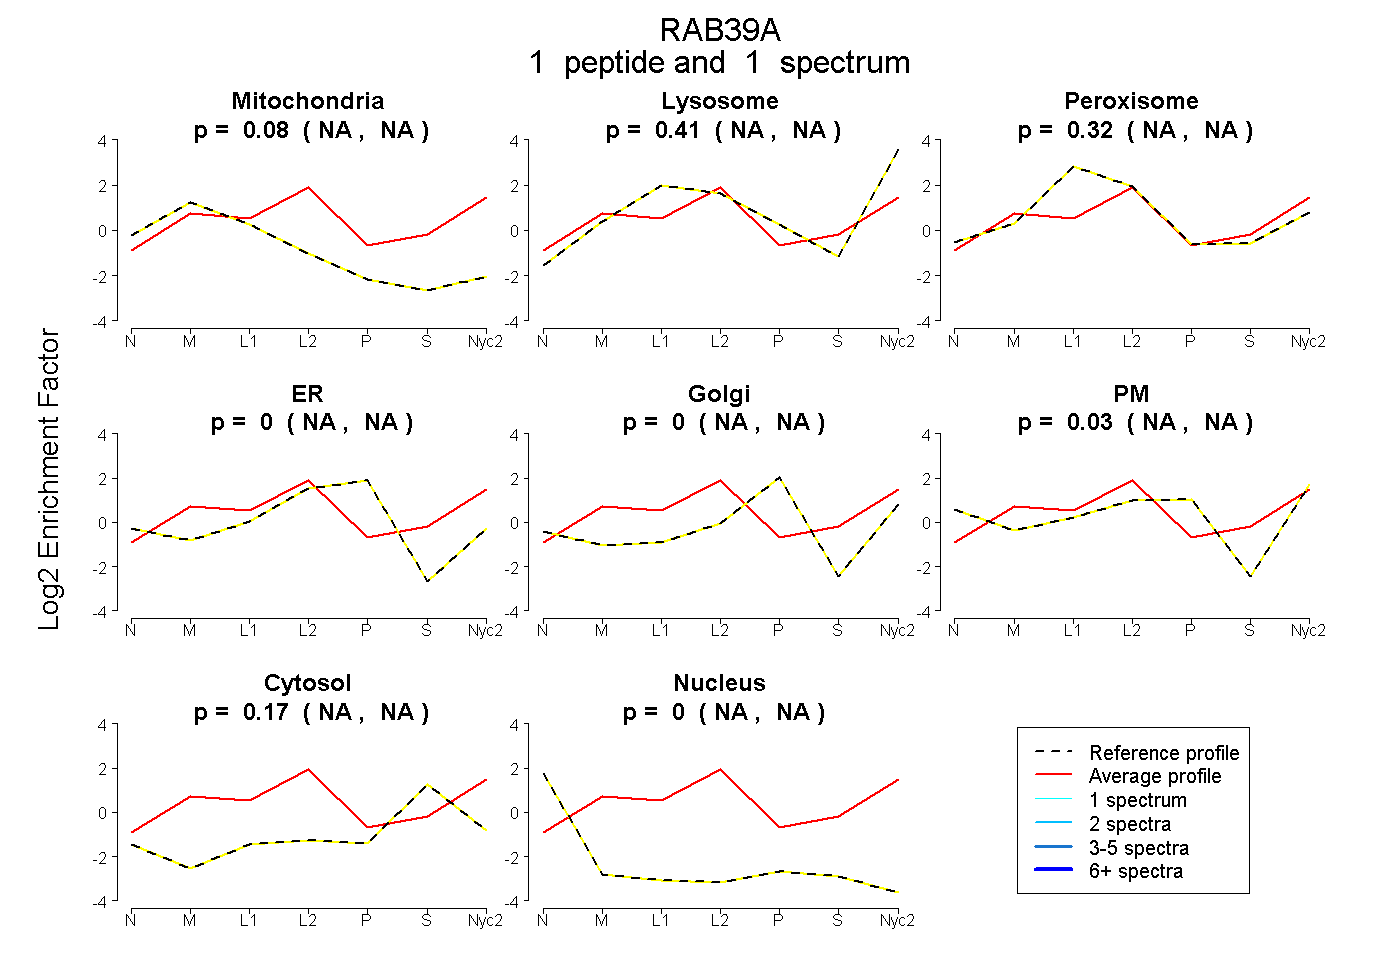
 1
1peptide
spectrum
NA | NA
NA | NA
NA | NA
NA | NA
NA | NA
NA | NA
NA | NA
NA | NA
| Plot | Mito | Lyso | Perox | ER | Golgi | PM | Cytosol | Nucleus | |||||
| Expt A |
1 peptide |
1 spectrum |
|
0.076 NA | NA |
0.415 NA | NA |
0.318 NA | NA |
0.000 NA | NA |
0.000 NA | NA |
0.025 NA | NA |
0.166 NA | NA |
0.000 NA | NA |
| 1 spectrum, MHVQPFQIVFLLVGHK | 0.076 | 0.415 | 0.318 | 0.000 | 0.000 | 0.025 | 0.166 | 0.000 |
| Plot | Lyso | Other | |||||||||||
| Expt C |
1 peptide |
2 spectra |
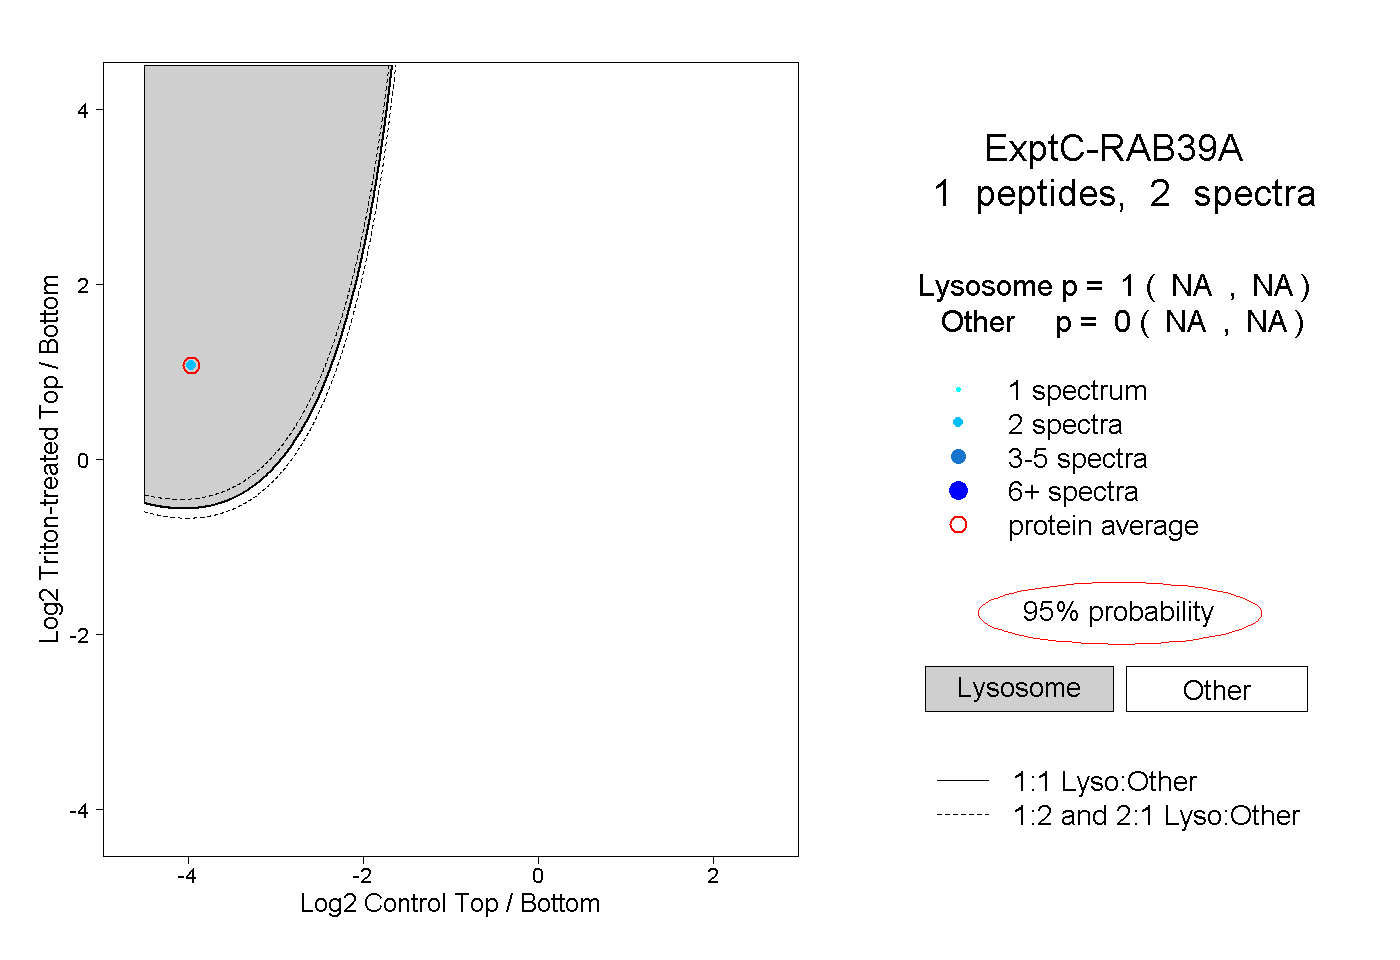 |
1.000 NA | NA |
0.000 NA | NA |