16
16peptides
spectra
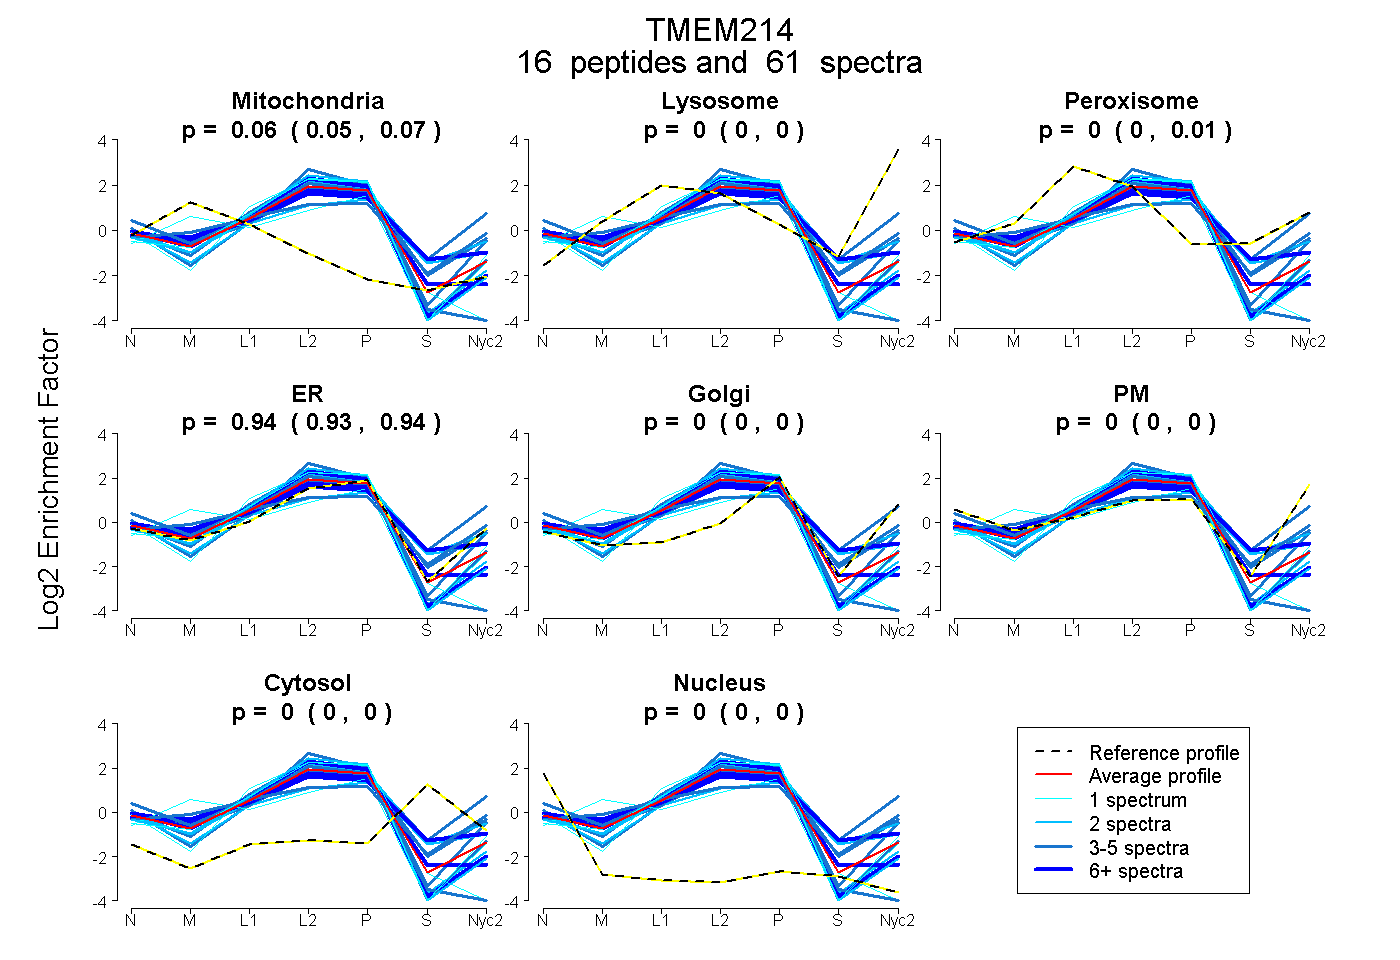
0.053 | 0.066
0.000 | 0.000
0.000 | 0.008
0.933 | 0.943
0.000 | 0.000
0.000 | 0.000
0.000 | 0.000
0.000 | 0.000
6peptides
spectra
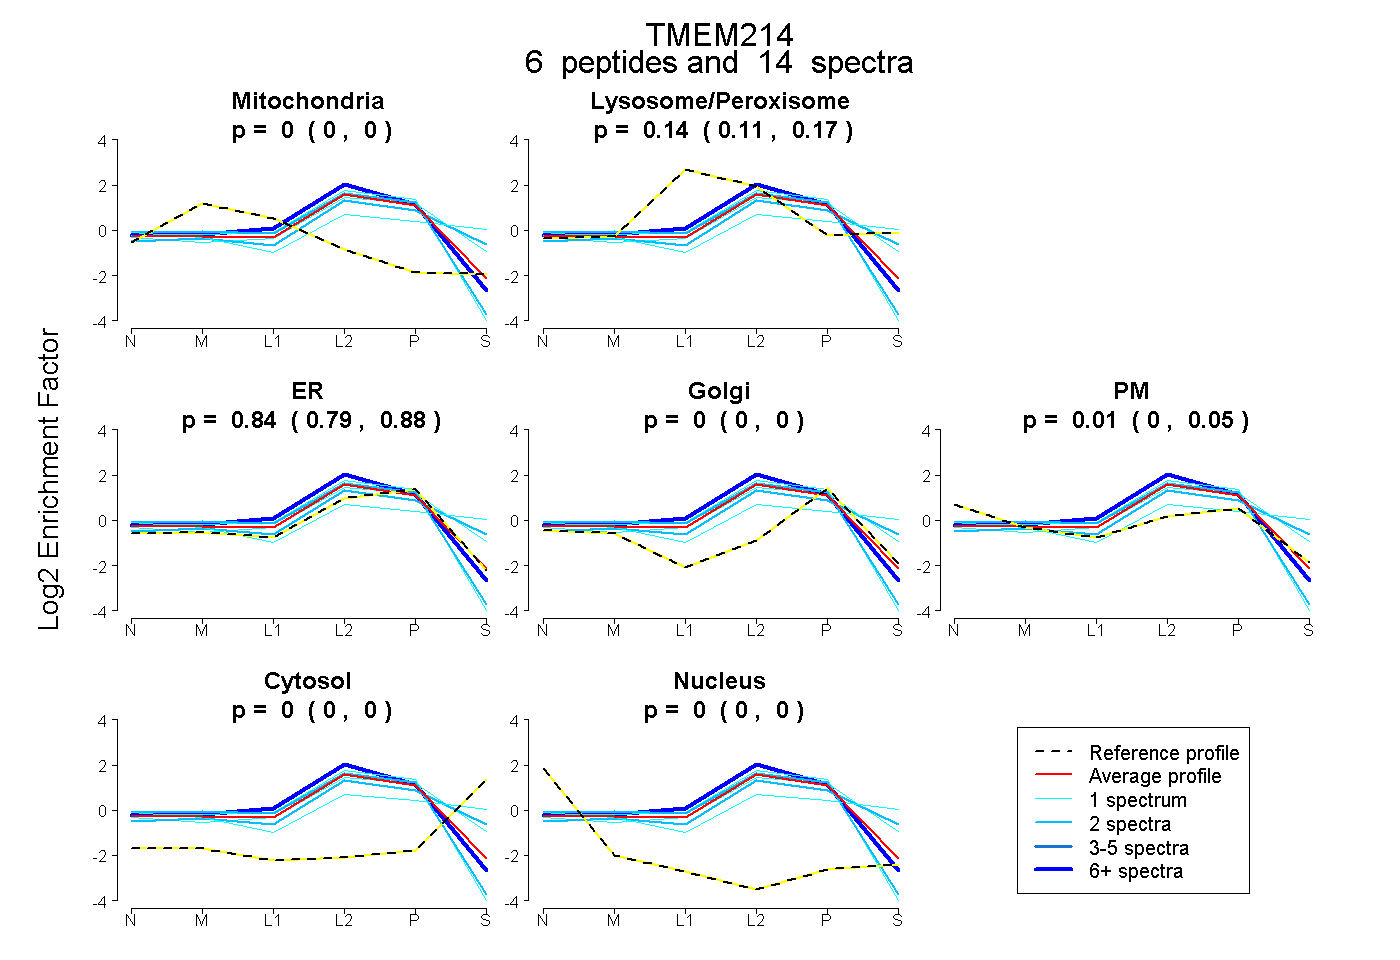
0.000 | 0.000
0.108 | 0.173
0.786 | 0.881
0.000 | 0.000
0.000 | 0.046
0.000 | 0.000
0.000 | 0.000
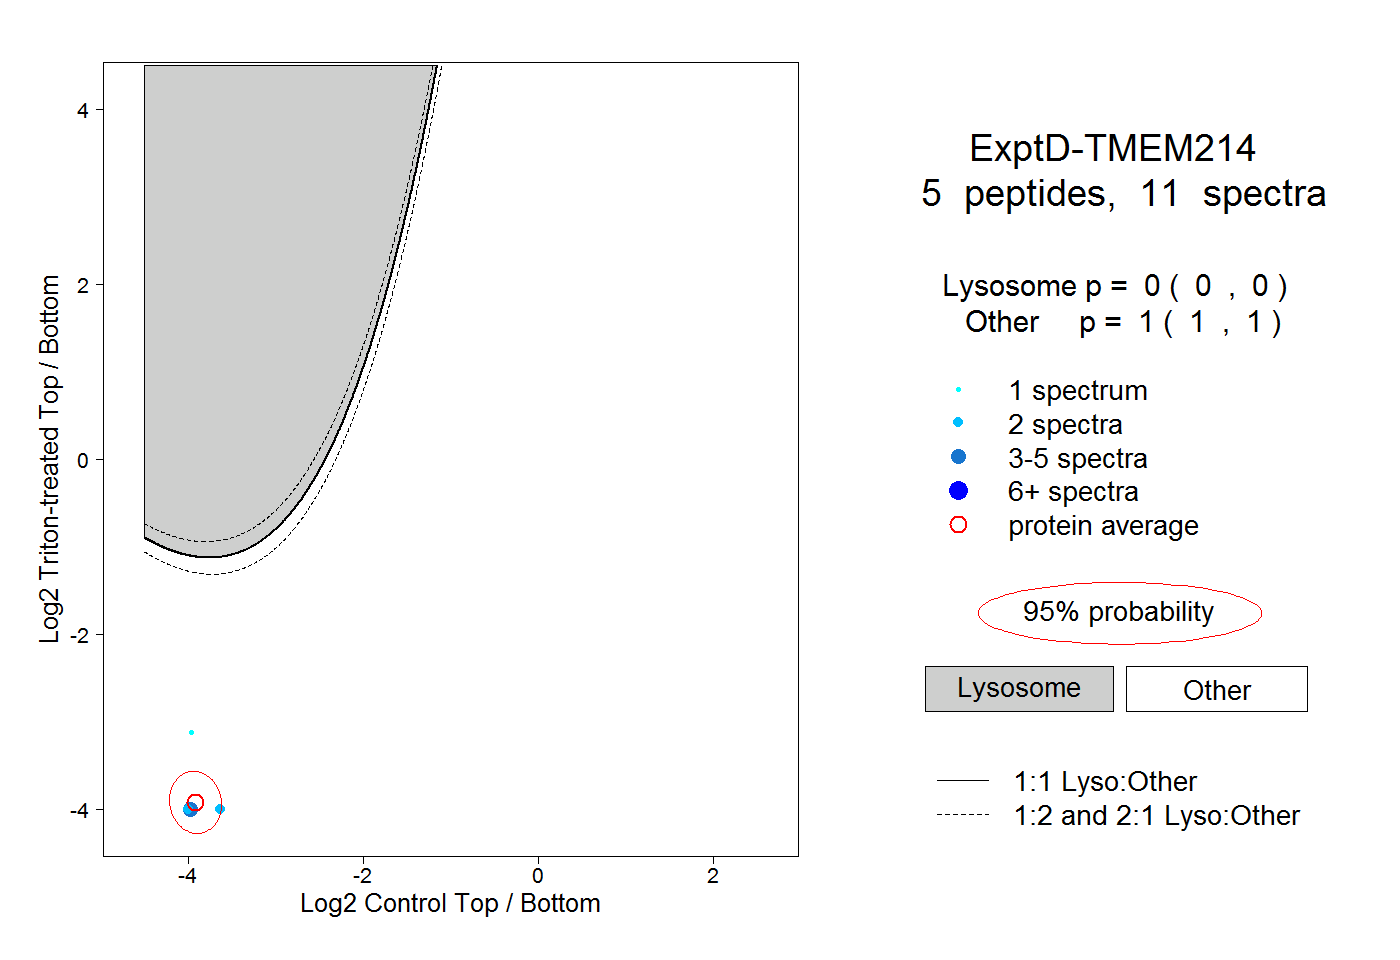
16peptides
spectra
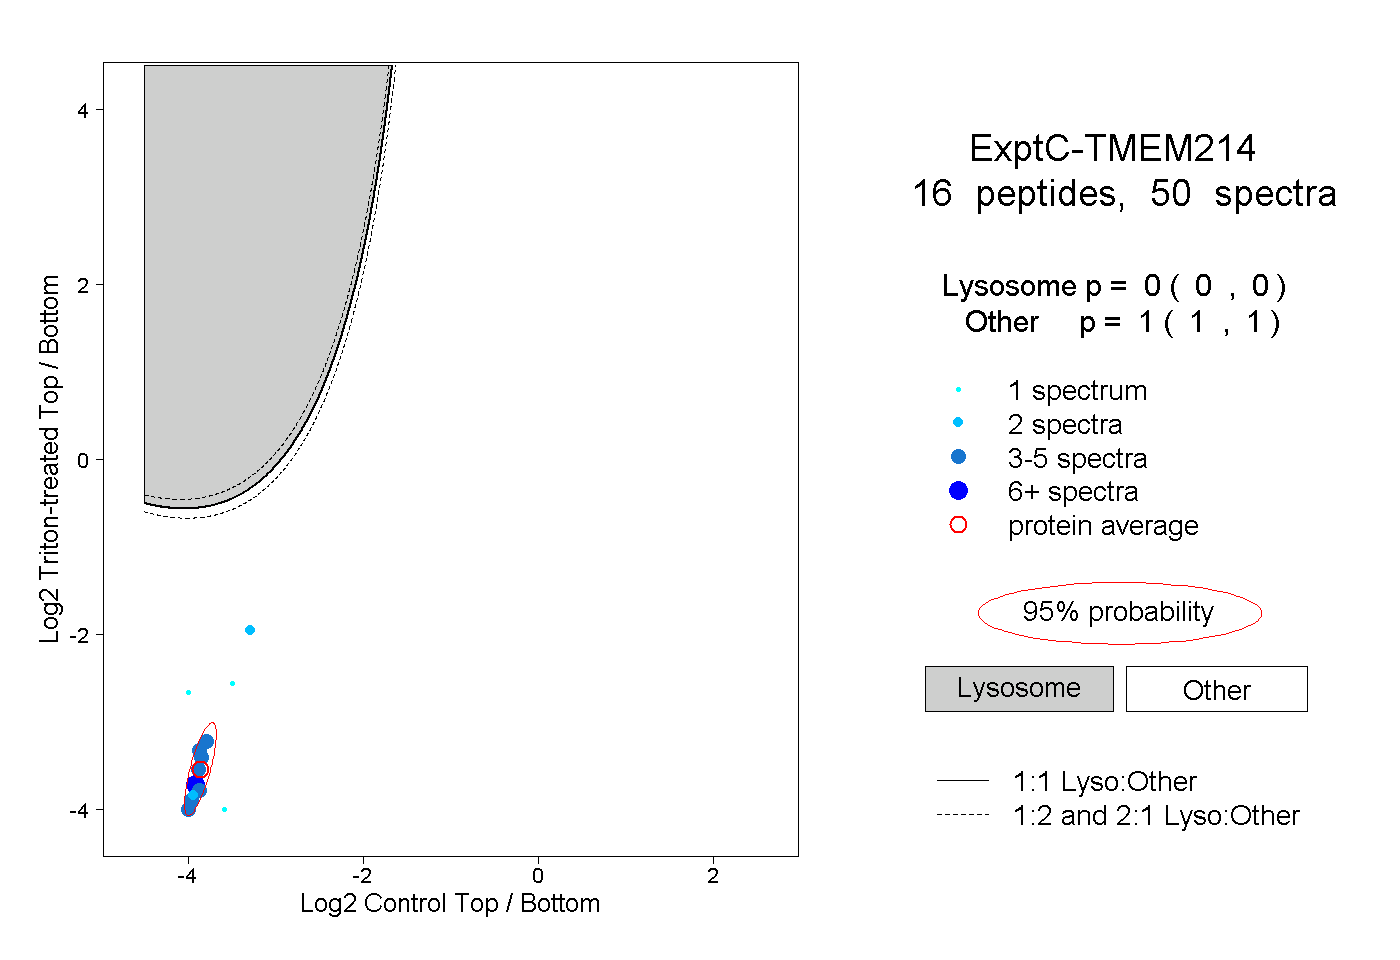
0.000 | 0.000
1.000 | 1.000