TMEM214
[ENSRNOP00000011838]
Main page
| | | Plot |
Mito |
Lyso |
|
Perox |
ER |
Golgi |
PM |
Cytosol |
Nucleus |
|
| Expt A |
 16
16
peptides |
61
spectra |
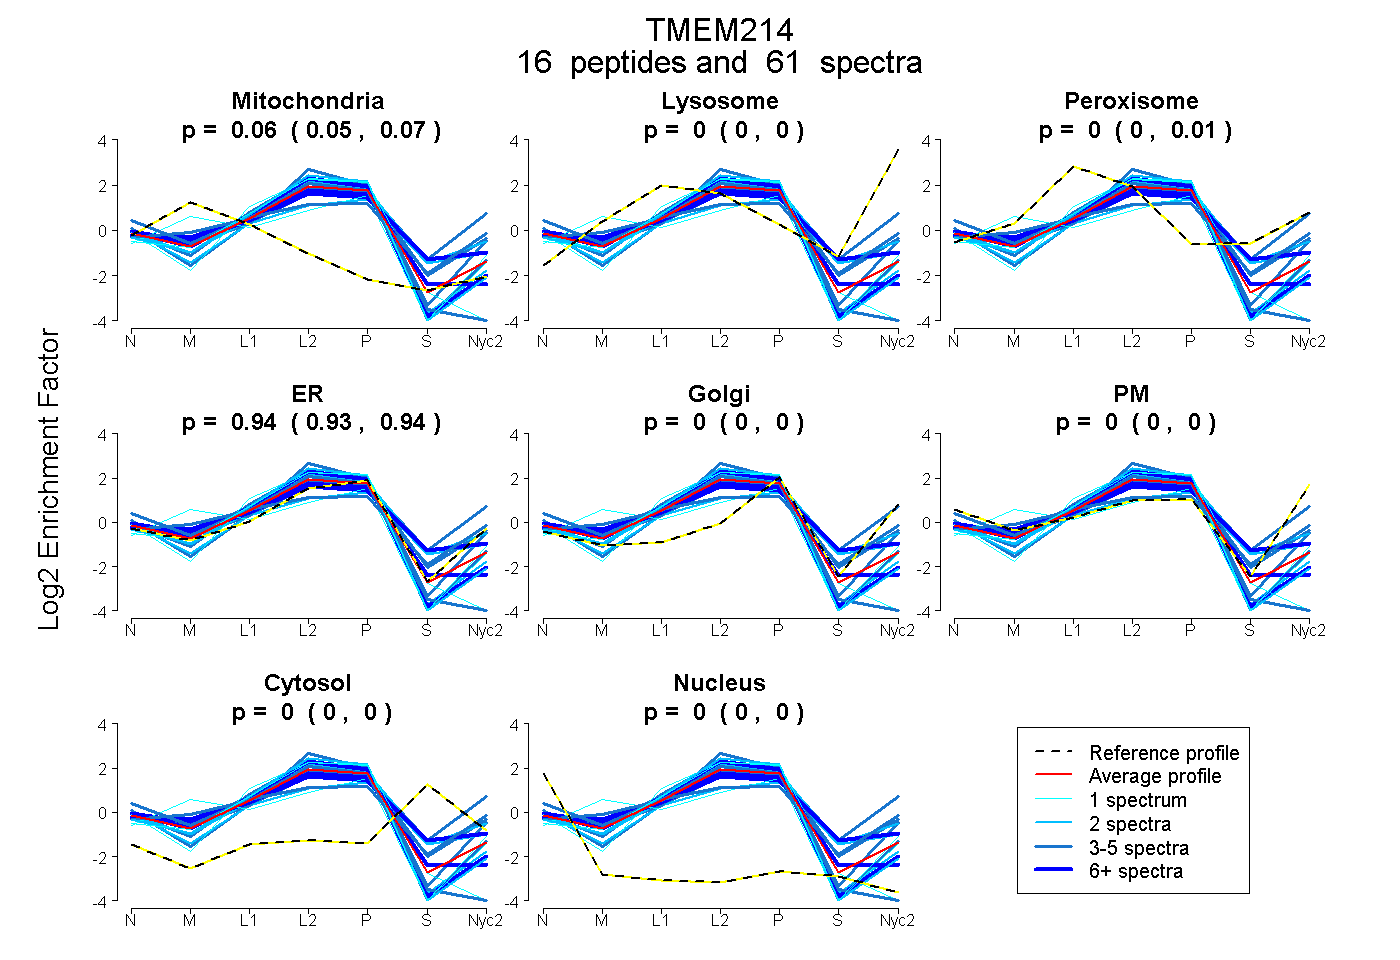 |
0.061
0.053 | 0.066 |
0.000
0.000 | 0.000 |
|
0.000
0.000 | 0.008 |
0.939
0.933 | 0.943 |
0.000
0.000 | 0.000 |
0.000
0.000 | 0.000 |
0.000
0.000 | 0.000 |
0.000
0.000 | 0.000 |
|
| | | Plot |
Mito |
|
Lyso or Perox |
|
ER |
Golgi |
PM |
Cytosol |
Nucleus |
|
| Expt B |
6
peptides |
14
spectra |
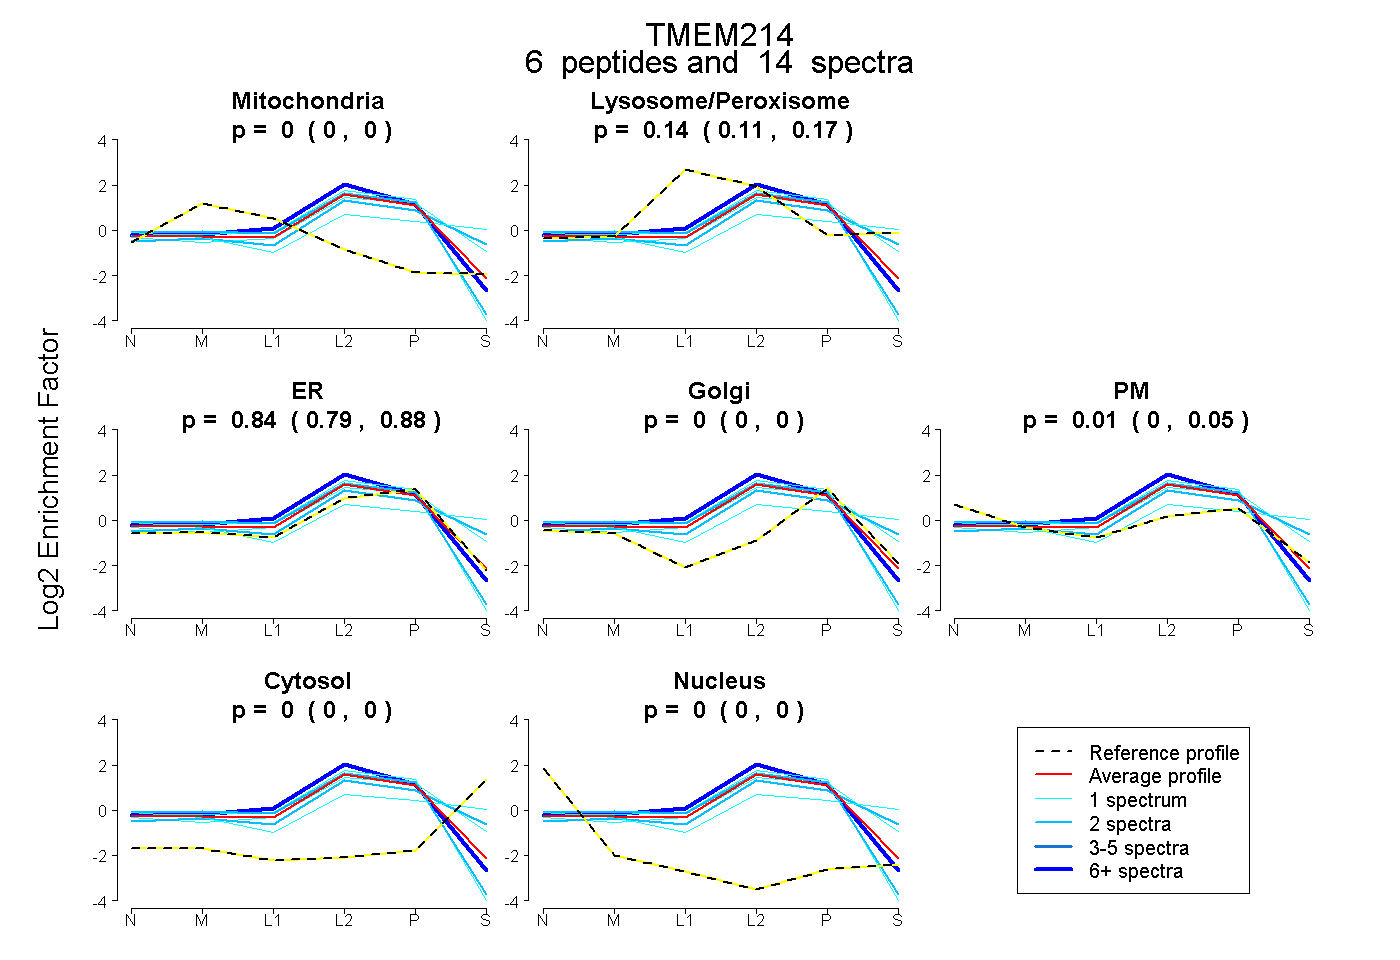 |
0.000
0.000 | 0.000 |
|
0.143
0.108 | 0.173 |
|
0.844
0.786 | 0.881 |
0.000
0.000 | 0.000 |
0.013
0.000 | 0.046 |
0.000
0.000 | 0.000 |
0.000
0.000 | 0.000 |
|
| 1 spectrum, GLLQQAR |
0.000 |
|
0.000 |
|
1.000 |
0.000 |
0.000 |
0.000 |
0.000 |
|
| 2 spectra, SLEDALK |
0.035 |
|
0.000 |
|
0.965 |
0.000 |
0.000 |
0.000 |
0.000 |
|
| 2 spectra, LLLMYPNLTK |
0.000 |
|
0.219 |
|
0.648 |
0.000 |
0.000 |
0.133 |
0.000 |
|
| 1 spectrum, ALDVAALQK |
0.000 |
|
0.240 |
|
0.710 |
0.000 |
0.000 |
0.050 |
0.000 |
|
| 7 spectra, FLELLR |
0.000 |
|
0.175 |
|
0.825 |
0.000 |
0.000 |
0.000 |
0.000 |
|
| 1 spectrum, VTAVASQNQK |
0.000 |
|
0.197 |
|
0.247 |
0.000 |
0.305 |
0.251 |
0.000 |
|
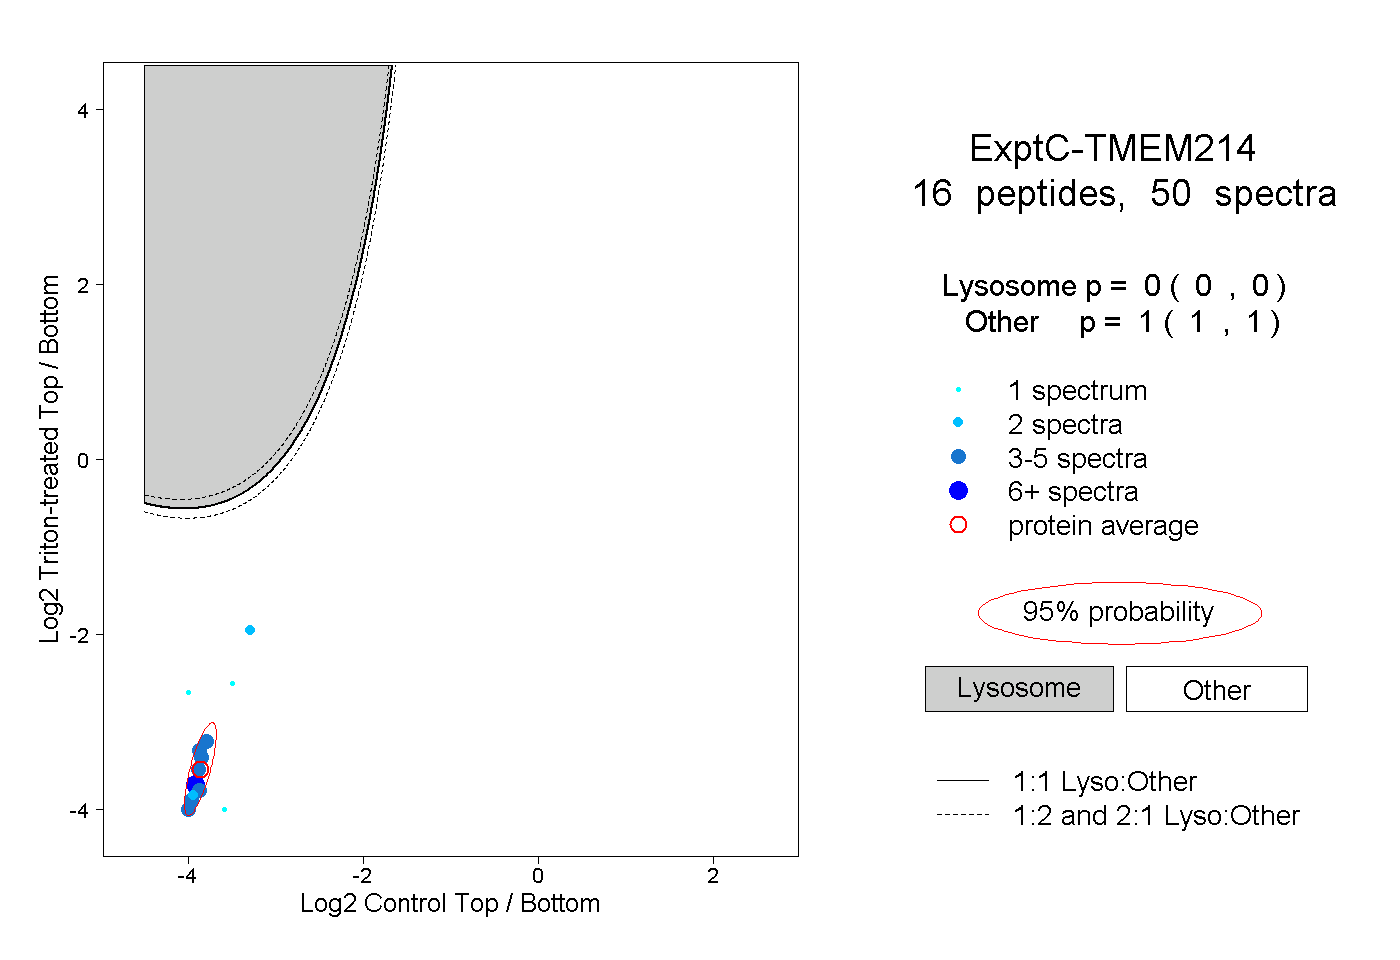
| | | Plot |
|
Lyso |
|
|
|
|
|
|
|
Other |
| Expt C |
16
peptides |
50
spectra |
 |
|
0.000
0.000 | 0.000 |
|
|
|
|
|
|
|
1.000
1.000 | 1.000 |
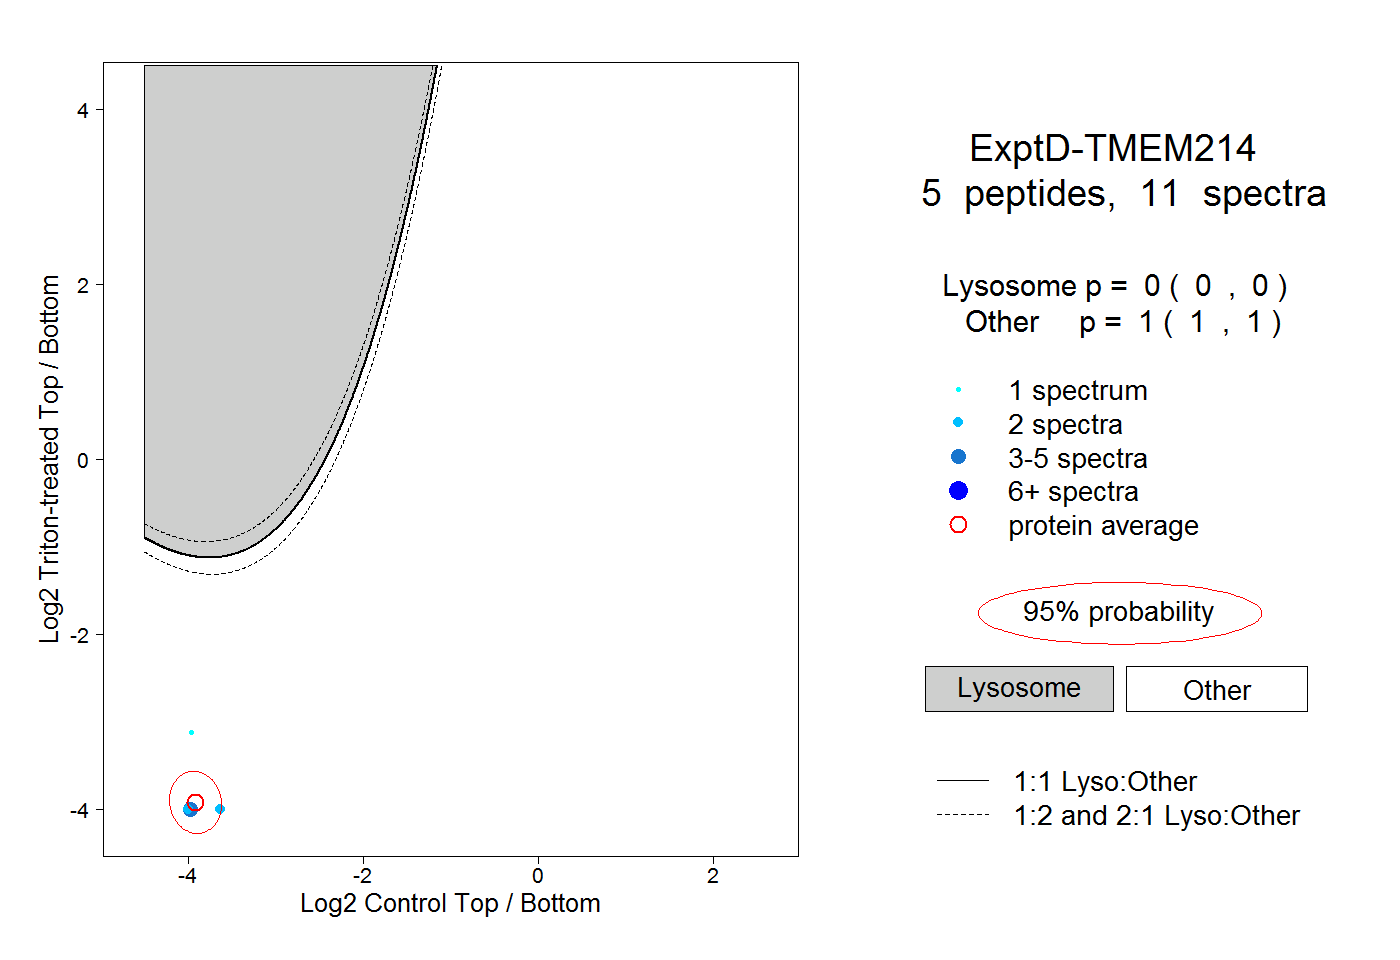
| | | Plot |
|
Lyso |
|
|
|
|
|
|
|
Other |
| Expt D |
5
peptides |
11
spectra |
 |
|
0.000
0.000 | 0.000 |
|
|
|
|
|
|
|
1.000
1.000 | 1.000 |