12
12peptides
spectra
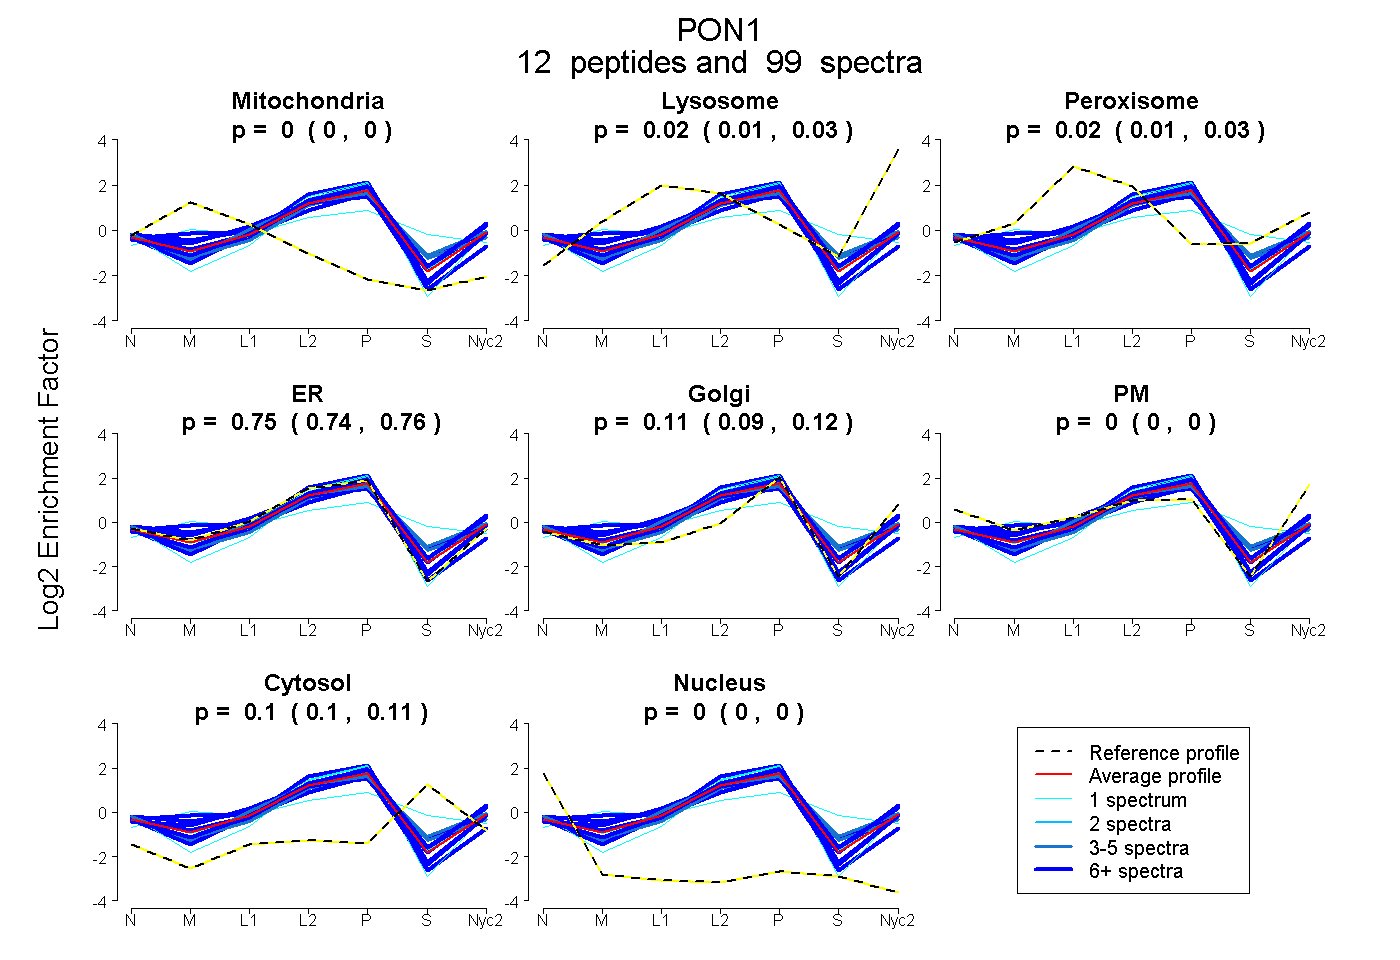
0.000 | 0.000
0.013 | 0.026
0.010 | 0.027
0.738 | 0.761
0.094 | 0.119
0.000 | 0.000
0.098 | 0.107
0.000 | 0.000
10peptides
spectra
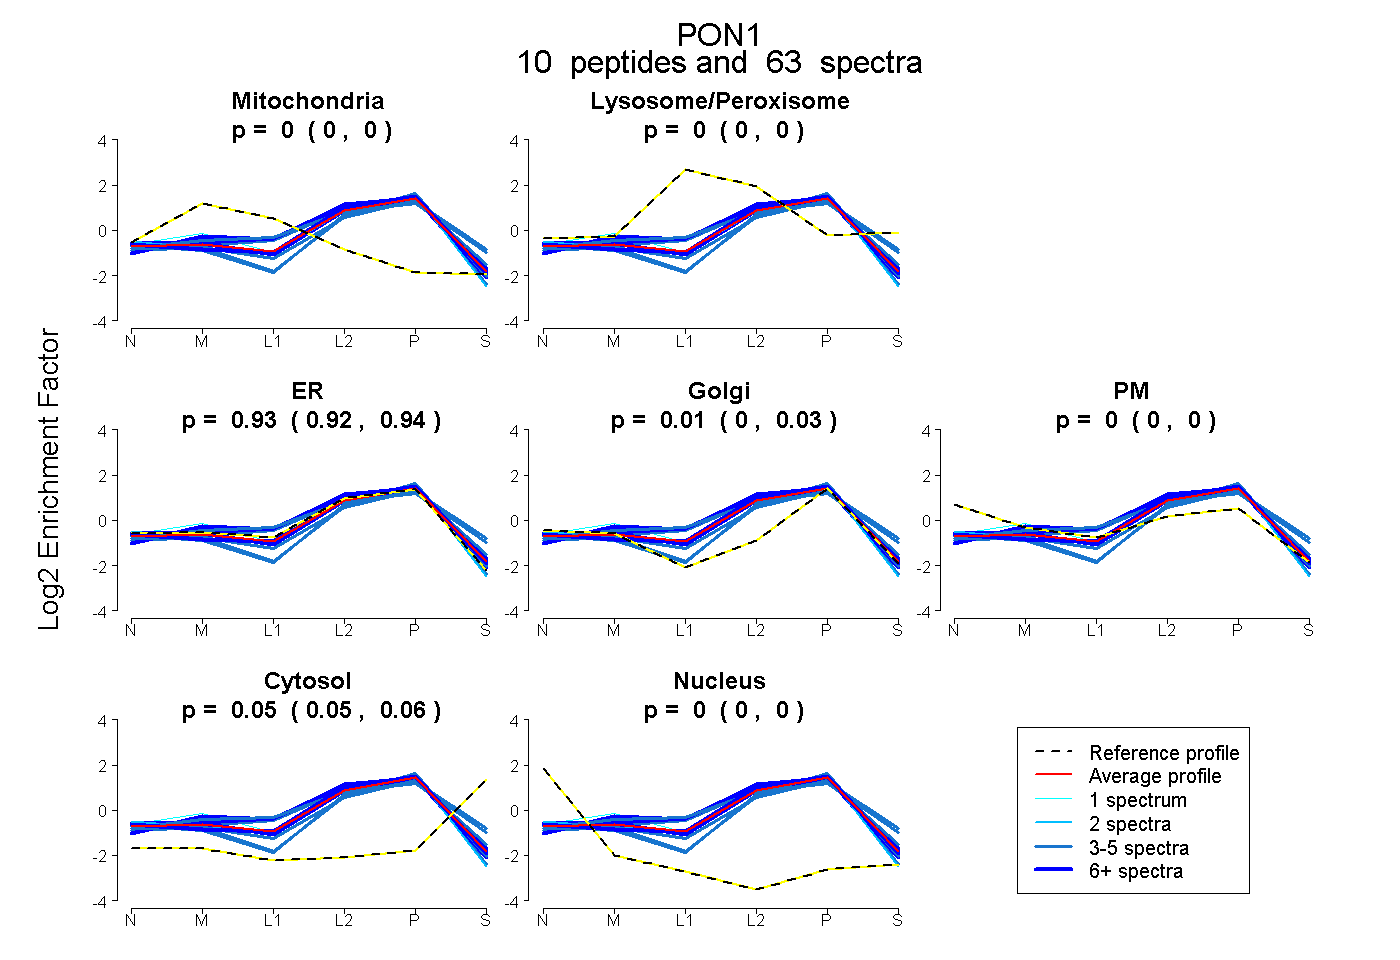
0.000 | 0.000
0.000 | 0.000
0.920 | 0.944
0.000 | 0.027
0.000 | 0.000
0.048 | 0.056
0.000 | 0.000